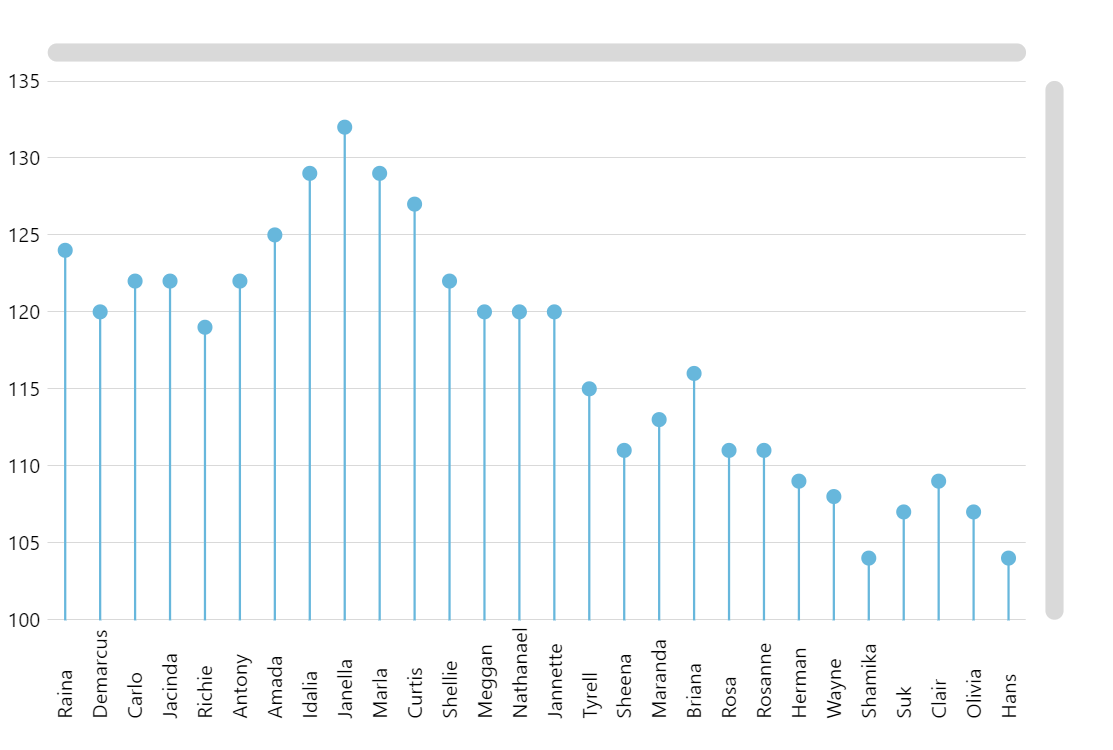
Lollipop Chart
A variation of column chart, also known as lollipop plot. As you can see, the name probably doesn’t need an explanation. So, let’s get straight to how to make it.
Key implementation details
There are two things you need to do to turn a column chart into a lollipop chart. First, we set the width of columns to 0.5 pixels so they appear as lines series.columns.template.setAll({ width: 0.5 });
And then we just a add a 5px circle as a bullet.
Related tutorials
Demo source
<!-- Styles -->
<style>
#chartdiv {
  width: 100%;
  height: 500px;
}
</style>

<!-- Resources -->
<script src="https://cdn.amcharts.com/lib/5/index.js"></script>
<script src="https://cdn.amcharts.com/lib/5/xy.js"></script>
<script src="https://cdn.amcharts.com/lib/5/themes/Animated.js"></script>

<!-- Chart code -->
<script>
am5.ready(function() {


// Create root element
// https://www.amcharts.com/docs/v5/getting-started/#Root_element
var root = am5.Root.new("chartdiv");


// Set themes
// https://www.amcharts.com/docs/v5/concepts/themes/
root.setThemes([
  am5themes_Animated.new(root)
]);


// Create chart
// https://www.amcharts.com/docs/v5/charts/xy-chart/
var chart = root.container.children.push(am5xy.XYChart.new(root, {
  panX: true,
  panY: true,
  wheelX: "panX",
  wheelY: "zoomX",
  scrollbarX: am5.Scrollbar.new(root, { orientation: "horizontal" }),
  scrollbarY: am5.Scrollbar.new(root, { orientation: "vertical" }),
  pinchZoomX: true,
  paddingLeft: 0
}));


// Add cursor
// https://www.amcharts.com/docs/v5/charts/xy-chart/cursor/
var cursor = chart.set("cursor", am5xy.XYCursor.new(root, {}));
cursor.lineY.set("visible", false);


// Create axes
// https://www.amcharts.com/docs/v5/charts/xy-chart/axes/
var xRenderer = am5xy.AxisRendererX.new(root, {
  minGridDistance: 15,
  minorGridEnabled: true
});

xRenderer.labels.template.setAll({
  rotation: -90,
  centerY: am5.p50,
  centerX: 0
});

xRenderer.grid.template.setAll({
  visible: false
});

var xAxis = chart.xAxes.push(am5xy.CategoryAxis.new(root, {
  maxDeviation: 0.3,
  categoryField: "category",
  renderer: xRenderer,
  tooltip: am5.Tooltip.new(root, {})
}));

var yAxis = chart.yAxes.push(am5xy.ValueAxis.new(root, {
  maxDeviation: 0.3,
  renderer: am5xy.AxisRendererY.new(root, {})
  }));


// Create series
// https://www.amcharts.com/docs/v5/charts/xy-chart/series/
var series = chart.series.push(am5xy.ColumnSeries.new(root, {
  xAxis: xAxis,
  yAxis: yAxis,
  valueYField: "value",
  categoryXField: "category",
  adjustBulletPosition: false,
  tooltip: am5.Tooltip.new(root, {
    labelText: "{valueY}"
  })
}));
series.columns.template.setAll({
  width: 0.5
});

series.bullets.push(function() {
  return am5.Bullet.new(root, {
    locationY: 1,
    sprite: am5.Circle.new(root, {
      radius: 5,
      fill: series.get("fill")
    })
  })
})


// Set data
var data = [];
var value = 120;

var names = ["Raina",
  "Demarcus",
  "Carlo",
  "Jacinda",
  "Richie",
  "Antony",
  "Amada",
  "Idalia",
  "Janella",
  "Marla",
  "Curtis",
  "Shellie",
  "Meggan",
  "Nathanael",
  "Jannette",
  "Tyrell",
  "Sheena",
  "Maranda",
  "Briana",
  "Rosa",
  "Rosanne",
  "Herman",
  "Wayne",
  "Shamika",
  "Suk",
  "Clair",
  "Olivia",
  "Hans"
];

for (var i = 0; i < names.length; i++) {
  value += Math.round((Math.random() < 0.5 ? 1 : -1) * Math.random() * 5);
  data.push({ category: names[i], value: value });
}

xAxis.data.setAll(data);
series.data.setAll(data);


// Make stuff animate on load
// https://www.amcharts.com/docs/v5/concepts/animations/
series.appear(1000);
chart.appear(1000, 100);

}); // end am5.ready()
</script>

<!-- HTML -->
<div id="chartdiv"></div>