Manipulate chart data with mouse
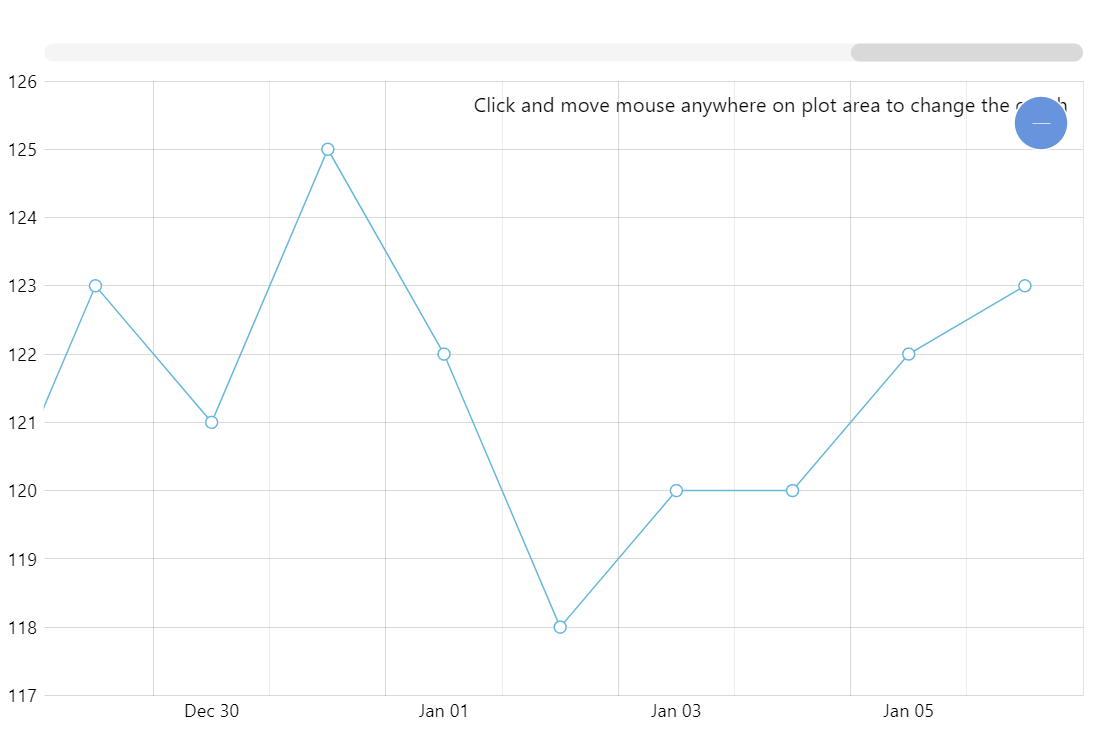
Click and move mouse anywhere on plot area to change the graph.
Key implementation details
We setup pointer event handlers and on globalpointermove event handler check whether the user is dragging a graph’s point and set its value according to the pointer coordinates converted to value with the positionToValue() method.
Related tutorials
Demo source
<!-- Styles -->
<style>
#chartdiv {
  width: 100%;
  max-width:100%;
  height: 500px;
}
</style>

<!-- Resources -->
<script src="https://cdn.amcharts.com/lib/5/index.js"></script>
<script src="https://cdn.amcharts.com/lib/5/xy.js"></script>
<script src="https://cdn.amcharts.com/lib/5/themes/Animated.js"></script>
<script src="https://cdn.amcharts.com/lib/5/themes/Responsive.js"></script>

<!-- Chart code -->
<script>
am5.ready(function() {

// Create root element
// https://www.amcharts.com/docs/v5/getting-started/#Root_element
var root = am5.Root.new("chartdiv");

const myTheme = am5.Theme.new(root);

myTheme.rule("AxisLabel", ["minor"]).setAll({
  dy:1
});

myTheme.rule("AxisLabel").setAll({
  fontSize:"0.9em"
});


// Set themes
// https://www.amcharts.com/docs/v5/concepts/themes/
root.setThemes([
  am5themes_Animated.new(root),
  myTheme,
  am5themes_Responsive.new(root)
]);


// Create chart
// https://www.amcharts.com/docs/v5/charts/xy-chart/
var chart = root.container.children.push(am5xy.XYChart.new(root, {
  wheelX: "panX",
  wheelY: "zoomX",
  pinchZoomX: true,
  paddingLeft: 0
}));


// Add cursor
// https://www.amcharts.com/docs/v5/charts/xy-chart/cursor/
var cursor = chart.set("cursor", am5xy.XYCursor.new(root, {
  behavior: "none"
}));
cursor.lineY.set("visible", false);


// Generate random data
var date = new Date();
date.setHours(0, 0, 0, 0);
var value = 100;

function generateData() {
  value = Math.round((Math.random() * 10 - 5) + value);
  am5.time.add(date, "day", 1);
  return {
    date: date.getTime(),
    value: value
  };
}

function generateDatas(count) {
  var data = [];
  for (var i = 0; i < count; ++i) {
    data.push(generateData());
  }
  return data;
}


// Create axes
// https://www.amcharts.com/docs/v5/charts/xy-chart/axes/
var xAxis = chart.xAxes.push(am5xy.DateAxis.new(root, {
  maxDeviation: 0.2,
  baseInterval: {
    timeUnit: "day",
    count: 1
  },
  renderer: am5xy.AxisRendererX.new(root, {
    minorGridEnabled: true,
    minorLabelsEnabled: true
  }),
  tooltip: am5.Tooltip.new(root, {})
}));

xAxis.set("minorDateFormats", {
  "day":"dd",
  "month":"MMM"
});

var yAxis = chart.yAxes.push(am5xy.ValueAxis.new(root, {
  renderer: am5xy.AxisRendererY.new(root, {
    pan: "zoom"
  })
}));


// Add series
// https://www.amcharts.com/docs/v5/charts/xy-chart/series/
var series = chart.series.push(am5xy.LineSeries.new(root, {
  name: "Series",
  xAxis: xAxis,
  yAxis: yAxis,
  valueYField: "value",
  valueXField: "date",
  tooltip: am5.Tooltip.new(root, {
    labelText: "{valueY}"
  })
}));

series.bullets.push(function() {
  var graphics = am5.Circle.new(root, {
    radius: 4,
    interactive: true,
    cursorOverStyle: "ns-resize",
    stroke: series.get("stroke"),
    fill: am5.color(0xffffff)
  });

  return am5.Bullet.new(root, {
    sprite: graphics
  });
});

// Add scrollbar
// https://www.amcharts.com/docs/v5/charts/xy-chart/scrollbars/
chart.set("scrollbarX", am5.Scrollbar.new(root, {
  orientation: "horizontal"
}));

// manipulating with mouse code
var isDown = false;

// register down
chart.plotContainer.events.on("pointerdown", function() {
  isDown = true;
})
// register up
chart.plotContainer.events.on("globalpointerup", function() {
  isDown = false;
})

chart.plotContainer.events.on("globalpointermove", function(e) {
  // if pointer is down
  if (isDown) {
    // get tooltip data item
    var tooltipDataItem = series.get("tooltipDataItem");
    if (tooltipDataItem) {
      if (e.originalEvent) {

        var position = yAxis.coordinateToPosition(chart.plotContainer.toLocal(e.point).y);
        var value = yAxis.positionToValue(position);
        // need to set bot working and original value
        tooltipDataItem.set("valueY", value);
        tooltipDataItem.set("valueYWorking", value);
      }
    }
  }
})

chart.plotContainer.children.push(am5.Label.new(root, {
  x: am5.p100,
  centerX: am5.p100,
  text: "Click and move mouse anywhere on plot area to change the graph"
}))

// Set data
var data = generateDatas(40);
series.data.setAll(data);


// Make stuff animate on load
// https://www.amcharts.com/docs/v5/concepts/animations/
series.appear(1000);
chart.appear(1000, 100);

}); // end am5.ready()
</script>

<!-- HTML -->
<div id="chartdiv"></div>