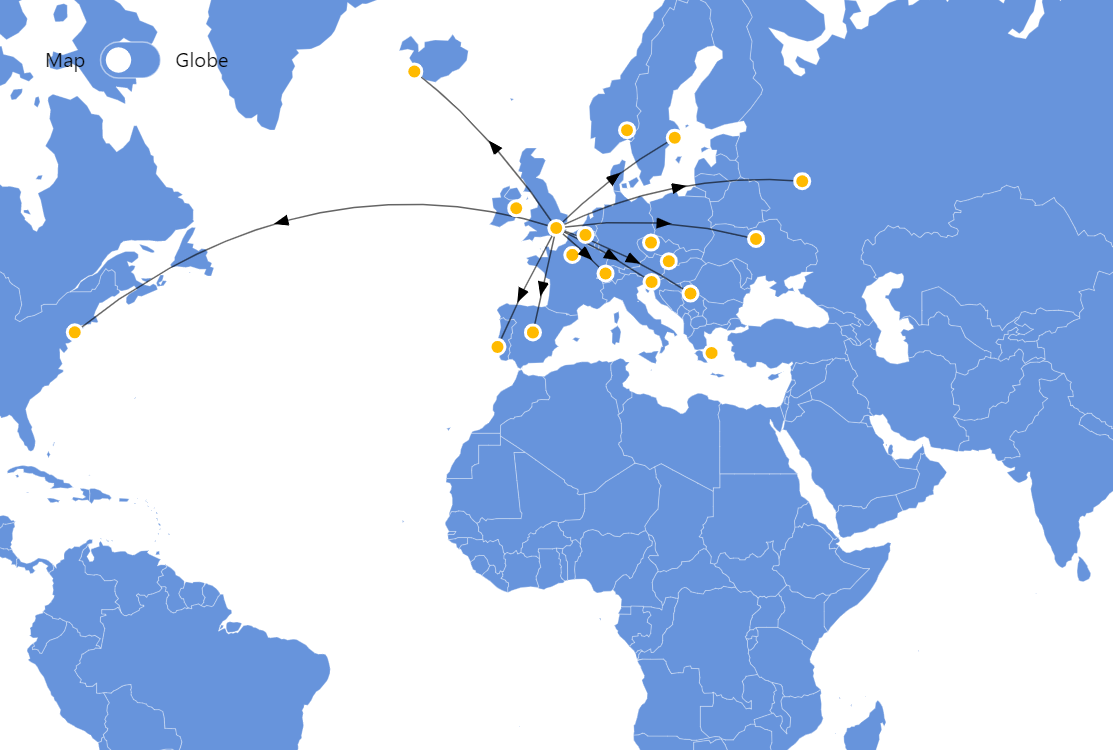
Map with Curved Lines
As you probably know, flat maps are not exactly geometrically accurate and we use different projections to transform our globe onto a flat surface. For this reason a straight (shortest path) line going from point A to point B wouldn’t be straight on a projected map. amCharts Maps takes care of this and enables you to create lines curved according to the current projection without doing any work to get there.
Key implementation details
To get the curved trajectory lines we just add a MapLineSeries to our chart, add data items to it with points to connect and amCharts Maps takes care of the rest.
Another interesting point in this demo is those map grid lines. You also get them for free by adding a GraticuleSeries to your map chart.
Related tutorials
Demo source
<!-- Styles -->
<style>
#chartdiv {
  width: 100%;
  height: 500px;
}
</style>

<!-- Resources -->
<script src="https://cdn.amcharts.com/lib/5/index.js"></script>
<script src="https://cdn.amcharts.com/lib/5/map.js"></script>
<script src="https://cdn.amcharts.com/lib/5/geodata/worldLow.js"></script>
<script src="https://cdn.amcharts.com/lib/5/themes/Animated.js"></script>

<!-- Chart code -->
<script>
am5.ready(function() {

// Create root element
// https://www.amcharts.com/docs/v5/getting-started/#Root_element
var root = am5.Root.new("chartdiv");


// Set themes
// https://www.amcharts.com/docs/v5/concepts/themes/
root.setThemes([
  am5themes_Animated.new(root)
]);


// Create the map chart
// https://www.amcharts.com/docs/v5/charts/map-chart/
var chart = root.container.children.push(am5map.MapChart.new(root, {
  panX: "translateX",
  panY: "translateY",
  projection: am5map.geoMercator()
}));

var cont = chart.children.push(am5.Container.new(root, {
  layout: root.horizontalLayout,
  x: 20,
  y: 40
}));


// Add labels and controls
cont.children.push(am5.Label.new(root, {
  centerY: am5.p50,
  text: "Map"
}));

var switchButton = cont.children.push(am5.Button.new(root, {
  themeTags: ["switch"],
  centerY: am5.p50,
  icon: am5.Circle.new(root, {
    themeTags: ["icon"]
  })
}));

switchButton.on("active", function() {
  if (!switchButton.get("active")) {
    chart.set("projection", am5map.geoMercator());
    chart.set("panX", "translateX");
    chart.set("panY", "translateY");
  }
  else {
    chart.set("projection", am5map.geoOrthographic());
    chart.set("panX", "rotateX");
    chart.set("panY", "rotateY");
  }
});

cont.children.push(am5.Label.new(root, {
  centerY: am5.p50,
  text: "Globe"
}));

// Create main polygon series for countries
// https://www.amcharts.com/docs/v5/charts/map-chart/map-polygon-series/
var polygonSeries = chart.series.push(am5map.MapPolygonSeries.new(root, {
  geoJSON: am5geodata_worldLow
}));

var graticuleSeries = chart.series.push(am5map.GraticuleSeries.new(root, {}));
graticuleSeries.mapLines.template.setAll({
  stroke: root.interfaceColors.get("alternativeBackground"),
  strokeOpacity: 0.08
});

// Create line series for trajectory lines
// https://www.amcharts.com/docs/v5/charts/map-chart/map-line-series/
var lineSeries = chart.series.push(am5map.MapLineSeries.new(root, {}));
lineSeries.mapLines.template.setAll({
  stroke: root.interfaceColors.get("alternativeBackground"),
  strokeOpacity: 0.6
});

// destination series
var citySeries = chart.series.push(
  am5map.MapPointSeries.new(root, {})
);

citySeries.bullets.push(function() {
  var circle = am5.Circle.new(root, {
    radius: 5,
    tooltipText: "{title}",
    tooltipY: 0,
    fill: am5.color(0xffba00),
    stroke: root.interfaceColors.get("background"),
    strokeWidth: 2
  });

  return am5.Bullet.new(root, {
    sprite: circle
  });
});

// arrow series
var arrowSeries = chart.series.push(
  am5map.MapPointSeries.new(root, {})
);

arrowSeries.bullets.push(function() {
  var arrow = am5.Graphics.new(root, {
    fill: am5.color(0x000000),
    stroke: am5.color(0x000000),
    draw: function (display) {
      display.moveTo(0, -3);
      display.lineTo(8, 0);
      display.lineTo(0, 3);
      display.lineTo(0, -3);
    }
  });

  return am5.Bullet.new(root, {
    sprite: arrow
  });
});

var cities = [
  {
    id: "london",
    title: "London",
    geometry: { type: "Point", coordinates: [-0.1262, 51.5002] },
  },
  {
    id: "brussels",
    title: "Brussels",
    geometry: { type: "Point", coordinates: [4.3676, 50.8371] }
  }, {
    id: "prague",
    title: "Prague",
    geometry: { type: "Point", coordinates: [14.4205, 50.0878] }
  }, {
    id: "athens",
    title: "Athens",
    geometry: { type: "Point", coordinates: [23.7166, 37.9792] }
  }, {
    id: "reykjavik",
    title: "Reykjavik",
    geometry: { type: "Point", coordinates: [-21.8952, 64.1353] }
  }, {
    id: "dublin",
    title: "Dublin",
    geometry: { type: "Point", coordinates: [-6.2675, 53.3441] }
  }, {
    id: "oslo",
    title: "Oslo",
    geometry: { type: "Point", coordinates: [10.7387, 59.9138] }
  }, {
    id: "lisbon",
    title: "Lisbon",
    geometry: { type: "Point", coordinates: [-9.1355, 38.7072] }
  }, {
    id: "moscow",
    title: "Moscow",
    geometry: { type: "Point", coordinates: [37.6176, 55.7558] }
  }, {
    id: "belgrade",
    title: "Belgrade",
    geometry: { type: "Point", coordinates: [20.4781, 44.8048] }
  }, {
    id: "bratislava",
    title: "Bratislava",
    geometry: { type: "Point", coordinates: [17.1547, 48.2116] }
  }, {
    id: "ljublana",
    title: "Ljubljana",
    geometry: { type: "Point", coordinates: [14.5060, 46.0514] }
  }, {
    id: "madrid",
    title: "Madrid",
    geometry: { type: "Point", coordinates: [-3.7033, 40.4167] }
  }, {
    id: "stockholm",
    title: "Stockholm",
    geometry: { type: "Point", coordinates: [18.0645, 59.3328] }
  }, {
    id: "bern",
    title: "Bern",
    geometry: { type: "Point", coordinates: [7.4481, 46.9480] }
  }, {
    id: "kiev",
    title: "Kiev",
    geometry: { type: "Point", coordinates: [30.5367, 50.4422] }
  }, {
    id: "paris",
    title: "Paris",
    geometry: { type: "Point", coordinates: [2.3510, 48.8567] }
  }, {
    id: "new york",
    title: "New York",
    geometry: { type: "Point", coordinates: [-74, 40.43] }
  }];

citySeries.data.setAll(cities);

// prepare line series data
var destinations = ["reykjavik", "lisbon", "moscow", "belgrade", "ljublana", "madrid", "stockholm", "bern", "kiev", "new york"];
// London coordinates
var originLongitude = -0.1262;
var originLatitude = 51.5002;

am5.array.each(destinations, function (did) {
  var destinationDataItem = citySeries.getDataItemById(did);
  var lineDataItem = lineSeries.pushDataItem({ geometry: { type: "LineString", coordinates: [[originLongitude, originLatitude], [destinationDataItem.get("longitude"), destinationDataItem.get("latitude")]] } });

  arrowSeries.pushDataItem({
    lineDataItem: lineDataItem,
    positionOnLine: 0.5,
    autoRotate: true
  });
})

polygonSeries.events.on("datavalidated", function () {
  chart.zoomToGeoPoint({ longitude: -0.1262, latitude: 51.5002 }, 3);
})


// Make stuff animate on load
chart.appear(1000, 100);

}); // end am5.ready()
</script>

<!-- HTML -->
<div id="chartdiv"></div>