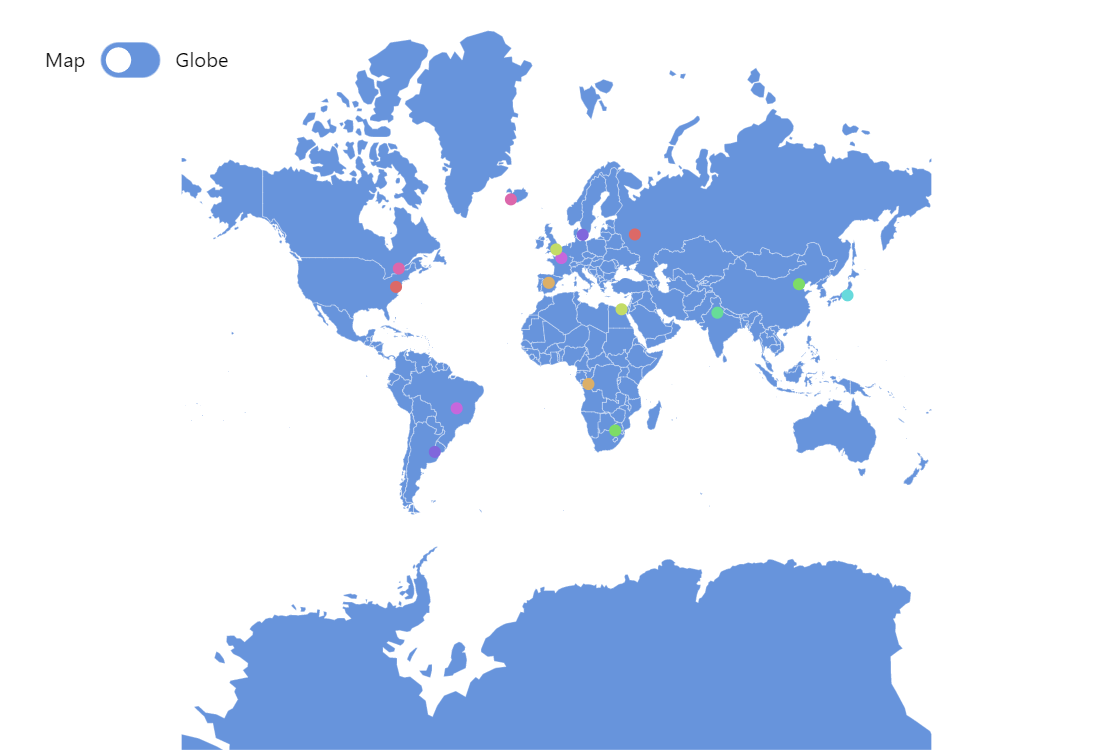
Map with Pulsating Bullets
This demo shows how to add animated dots to your maps. This could be useful to attract viewer’s attention to specific locations on the map.
Key implementation details
Our pulsating points are just bullets on MapPointSeries points. We create two circles as visuals for each data point bullet and then animate scale and opacity on one of the circles.
Related tutorials
Demo source
<!-- Styles -->
<style>
#chartdiv {
  width: 100%;
  height: 500px;
  overflow: hidden;
}
</style>

<!-- Resources -->
<script src="https://cdn.amcharts.com/lib/5/index.js"></script>
<script src="https://cdn.amcharts.com/lib/5/map.js"></script>
<script src="https://cdn.amcharts.com/lib/5/geodata/worldLow.js"></script>
<script src="https://cdn.amcharts.com/lib/5/themes/Animated.js"></script>

<!-- Chart code -->
<script>
am5.ready(function() {

/**
 * ---------------------------------------
 * This demo was created using amCharts 5.
 *
 * For more information visit:
 * https://www.amcharts.com/
 *
 * Documentation is available at:
 * https://www.amcharts.com/docs/v5/
 * ---------------------------------------
 */

// Create root element
// https://www.amcharts.com/docs/v5/getting-started/#Root_element
var root = am5.Root.new("chartdiv");

// Set themes
// https://www.amcharts.com/docs/v5/concepts/themes/
root.setThemes([am5themes_Animated.new(root)]);

// Create the map chart
// https://www.amcharts.com/docs/v5/charts/map-chart/
var chart = root.container.children.push(
  am5map.MapChart.new(root, {
    panX: "rotateX",
    panY: "translateY",
    projection: am5map.geoMercator()
  })
);

var cont = chart.children.push(
  am5.Container.new(root, {
    layout: root.horizontalLayout,
    x: 20,
    y: 40
  })
);

// Add labels and controls
cont.children.push(
  am5.Label.new(root, {
    centerY: am5.p50,
    text: "Map"
  })
);

var switchButton = cont.children.push(
  am5.Button.new(root, {
    themeTags: ["switch"],
    centerY: am5.p50,
    icon: am5.Circle.new(root, {
      themeTags: ["icon"]
    })
  })
);

switchButton.on("active", function() {
  if (!switchButton.get("active")) {
    chart.set("projection", am5map.geoMercator());
    chart.set("panY", "translateY");
    chart.set("rotationY", 0);
    backgroundSeries.mapPolygons.template.set("fillOpacity", 0);
  } else {
    chart.set("projection", am5map.geoOrthographic());
    chart.set("panY", "rotateY");

    backgroundSeries.mapPolygons.template.set("fillOpacity", 0.1);
  }
});

cont.children.push(
  am5.Label.new(root, {
    centerY: am5.p50,
    text: "Globe"
  })
);

// Create series for background fill
// https://www.amcharts.com/docs/v5/charts/map-chart/map-polygon-series/#Background_polygon
var backgroundSeries = chart.series.push(am5map.MapPolygonSeries.new(root, {}));
backgroundSeries.mapPolygons.template.setAll({
  fill: root.interfaceColors.get("alternativeBackground"),
  fillOpacity: 0,
  strokeOpacity: 0
});

// Add background polygon
// https://www.amcharts.com/docs/v5/charts/map-chart/map-polygon-series/#Background_polygon
backgroundSeries.data.push({
  geometry: am5map.getGeoRectangle(90, 180, -90, -180)
});

// Create main polygon series for countries
// https://www.amcharts.com/docs/v5/charts/map-chart/map-polygon-series/
var polygonSeries = chart.series.push(
  am5map.MapPolygonSeries.new(root, {
    geoJSON: am5geodata_worldLow
  })
);

// Create line series for trajectory lines
// https://www.amcharts.com/docs/v5/charts/map-chart/map-line-series/
var lineSeries = chart.series.push(am5map.MapLineSeries.new(root, {}));
lineSeries.mapLines.template.setAll({
  stroke: root.interfaceColors.get("alternativeBackground"),
  strokeOpacity: 0.3
});

// Create point series for markers
// https://www.amcharts.com/docs/v5/charts/map-chart/map-point-series/
var pointSeries = chart.series.push(am5map.MapPointSeries.new(root, {}));
var colorset = am5.ColorSet.new(root, {});

pointSeries.bullets.push(function() {
  var container = am5.Container.new(root, {
    tooltipText: "{title}",
    cursorOverStyle: "pointer"
  });

  container.events.on("click", (e) => {
    window.location.href = e.target.dataItem.dataContext.url;
  });


  var circle = container.children.push(
    am5.Circle.new(root, {
      radius: 4,
      tooltipY: 0,
      fill: colorset.next(),
      strokeOpacity: 0
    })
  );


  var circle2 = container.children.push(
    am5.Circle.new(root, {
      radius: 4,
      tooltipY: 0,
      fill: colorset.next(),
      strokeOpacity: 0,
      tooltipText: "{title}"
    })
  );

  circle.animate({
    key: "scale",
    from: 1,
    to: 5,
    duration: 600,
    easing: am5.ease.out(am5.ease.cubic),
    loops: Infinity
  });
  circle.animate({
    key: "opacity",
    from: 1,
    to: 0.1,
    duration: 600,
    easing: am5.ease.out(am5.ease.cubic),
    loops: Infinity
  });

  return am5.Bullet.new(root, {
    sprite: container
  });
});

var cities = [
  {
    title: "Brussels",
    latitude: 50.8371,
    longitude: 4.3676,
    url: "http://www.amcharts.com"
  },
  {
    title: "Copenhagen",
    latitude: 55.6763,
    longitude: 12.5681,
    url: "http://www.amcharts.com"
  },
  {
    title: "Paris",
    latitude: 48.8567,
    longitude: 2.351,
    url: "http://www.amcharts.com"
  },
  {
    title: "Reykjavik",
    latitude: 64.1353,
    longitude: -21.8952,
    url: "http://www.amcharts.com"
  },
  {
    title: "Moscow",
    latitude: 55.7558,
    longitude: 37.6176,
    url: "http://www.amcharts.com"
  },
  {
    title: "Madrid",
    latitude: 40.4167,
    longitude: -3.7033,
    url: "http://www.amcharts.com"
  },
  {
    title: "London",
    latitude: 51.5002,
    longitude: -0.1262,
    url: "http://www.amcharts.com"
  },
  {
    title: "Peking",
    latitude: 39.9056,
    longitude: 116.3958,
    url: "http://www.amcharts.com"
  },
  {
    title: "New Delhi",
    latitude: 28.6353,
    longitude: 77.225,
    url: "http://www.amcharts.com"
  },
  {
    title: "Tokyo",
    latitude: 35.6785,
    longitude: 139.6823,
    url: "http://www.amcharts.com"
  },
  {
    title: "Ankara",
    latitude: 39.9439,
    longitude: 32.856,
    url: "http://www.amcharts.com"
  },
  {
    title: "Buenos Aires",
    latitude: -34.6118,
    longitude: -58.4173,
    url: "http://www.amcharts.com"
  },
  {
    title: "Brasilia",
    latitude: -15.7801,
    longitude: -47.9292,
    url: "http://www.amcharts.com"
  },
  {
    title: "Ottawa",
    latitude: 45.4235,
    longitude: -75.6979,
    url: "http://www.amcharts.com"
  },
  {
    title: "Washington",
    latitude: 38.8921,
    longitude: -77.0241,
    url: "http://www.amcharts.com"
  },
  {
    title: "Kinshasa",
    latitude: -4.3369,
    longitude: 15.3271,
    url: "http://www.amcharts.com"
  },
  {
    title: "Cairo",
    latitude: 30.0571,
    longitude: 31.2272,
    url: "http://www.amcharts.com"
  },
  {
    title: "Pretoria",
    latitude: -25.7463,
    longitude: 28.1876,
    url: "http://www.amcharts.com"
  }
];

for (var i = 0; i < cities.length; i++) {
  var city = cities[i];
  addCity(city.longitude, city.latitude, city.title, city.url);
}

function addCity(longitude, latitude, title, url) {
  pointSeries.data.push({
    url: url,
    geometry: { type: "Point", coordinates: [longitude, latitude] },
    title: title
  });
}

// Make stuff animate on load
chart.appear(1000, 100);


}); // end am5.ready()
</script>

<!-- HTML -->
<div id="chartdiv"></div>