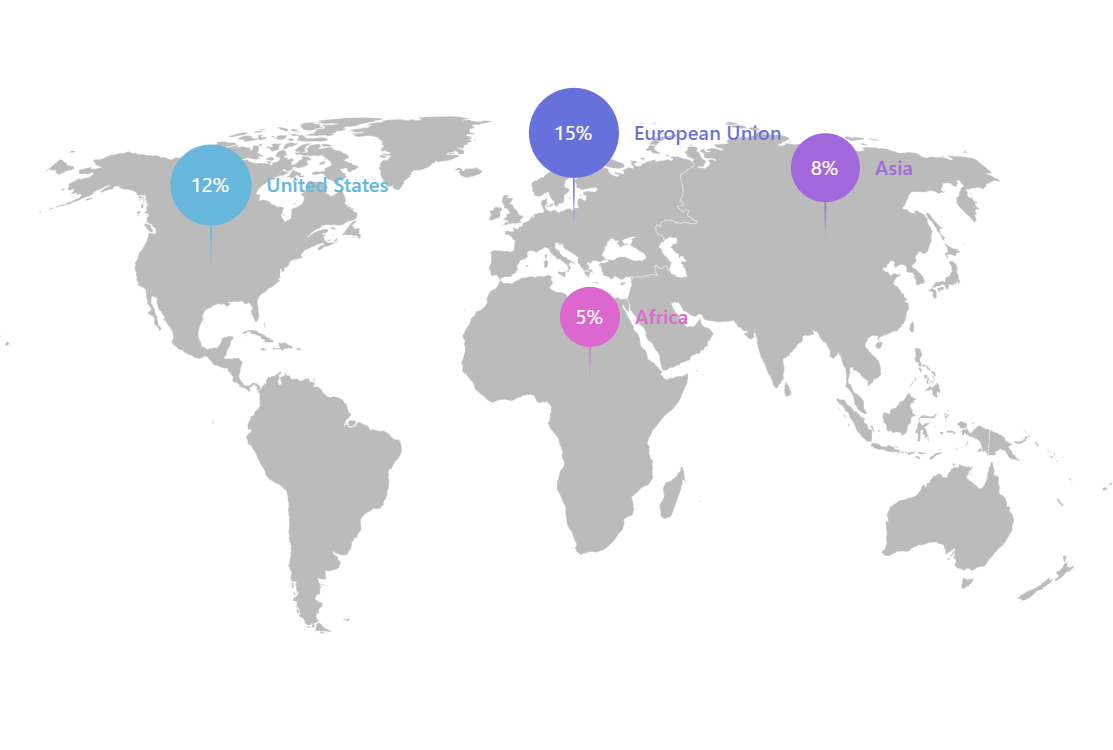
Map with Sized Pin Bullets
This demo implements pin-like bullets with the pin head size adjusted based on the corresponding value.
Key implementation details
We are working with bullets on a map point series. We create a Container which is a composite of the parts of our pin. We adjust the pin head radius based on the data item’s value and create a Circle in the container with that radius and vertically offset it accordingly. Then we create a Line for the pin pole and a Label. Finally, we set our composite container as the sprite for our Bullet.
Related tutorials
Demo source
<!-- Styles -->
<style>
#chartdiv {
  width: 100%;
  height: 500px;
}
</style>

<!-- Resources -->
<script src="https://cdn.amcharts.com/lib/5/index.js"></script>
<script src="https://cdn.amcharts.com/lib/5/percent.js"></script>
<script src="https://cdn.amcharts.com/lib/5/map.js"></script>
<script src="https://cdn.amcharts.com/lib/5/geodata/continentsLow.js"></script>
<script src="https://cdn.amcharts.com/lib/5/themes/Animated.js"></script>

<!-- Chart code -->
<script>
am5.ready(function() {

// Create root and chart
var root = am5.Root.new("chartdiv");

// Set themes
root.setThemes([
  am5themes_Animated.new(root)
]);


// ====================================
// Create map
// ====================================

var map = root.container.children.push(
  am5map.MapChart.new(root, {
    panX: "none",
    projection: am5map.geoNaturalEarth1()
  })
);

// Create polygon series
var polygonSeries = map.series.push(
  am5map.MapPolygonSeries.new(root, {
    geoJSON: am5geodata_continentsLow,
    exclude: ["antarctica"],
    fill: am5.color(0xbbbbbb)
  })
);

var pointSeries = map.series.push(
  am5map.MapPointSeries.new(root, {})
);

var colorSet = am5.ColorSet.new(root, {step:2});

pointSeries.bullets.push(function(root, series, dataItem) {
  var value = dataItem.dataContext.value;

  var container = am5.Container.new(root, {});
  var color = colorSet.next();
  var radius = 15 + value / 20 * 20;
  var circle = container.children.push(am5.Circle.new(root, {
    radius: radius,
    fill: color,
    dy: -radius * 2
  }))

  var pole = container.children.push(am5.Line.new(root, {
    stroke: color,
    height: -40,
    strokeGradient: am5.LinearGradient.new(root, {
      stops:[
        { opacity: 1 },
        { opacity: 1 },
        { opacity: 0 }
      ]
    })
  }));

  var label = container.children.push(am5.Label.new(root, {
    text: value + "%",
    fill: am5.color(0xffffff),
    fontWeight: "400",
    centerX: am5.p50,
    centerY: am5.p50,
    dy: -radius * 2
  }))

  var titleLabel = container.children.push(am5.Label.new(root, {
    text: dataItem.dataContext.title,
    fill: color,
    fontWeight: "500",
    fontSize: "1em",
    centerY: am5.p50,
    dy: -radius * 2,
    dx: radius
  }))

  return am5.Bullet.new(root, {
    sprite: container
  });
});


// ====================================
// Create pins
// ====================================

var data = [{
  "title": "United States",
  "latitude": 39.563353,
  "longitude": -99.316406,
  "width": 100,
  "height": 100,
  "value":12
}, {
  "title": "European Union",
  "latitude": 50.896104,
  "longitude": 19.160156,
  "width": 50,
  "height": 50,
  "value":15
}, {
  "title": "Asia",
  "latitude": 47.212106,
  "longitude": 103.183594,
  "width": 80,
  "height": 80,
  "value":8
}, {
  "title": "Africa",
  "latitude": 11.081385,
  "longitude": 21.621094,
  "width": 50,
  "height": 50,
  "value":5
}];

for (var i = 0; i < data.length; i++) {
  var d = data[i];
  pointSeries.data.push({
    geometry: { type: "Point", coordinates: [d.longitude, d.latitude] },
    title: d.title,
    value: d.value
  });
}

}); // end am5.ready()
</script>

<!-- HTML -->
<div id="chartdiv"></div>