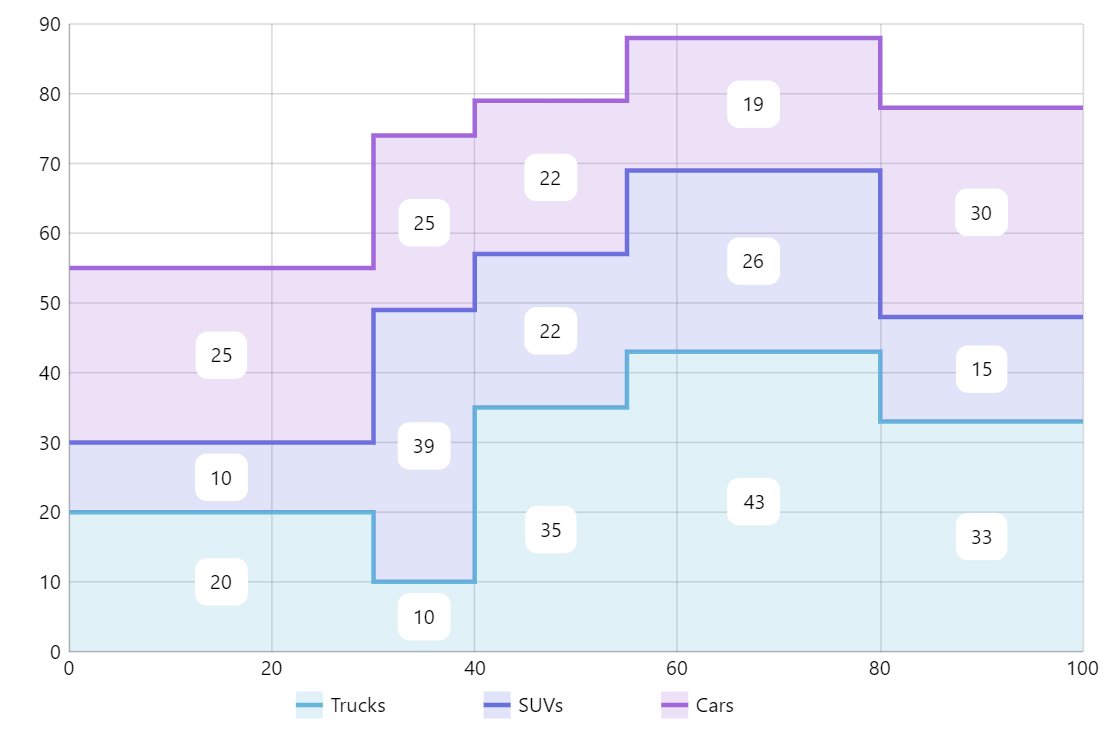
Mekko Chart
Mekko or Marimekko chart is a variation of stacked area charts with varied-width categories.
This demo uses XYChart with StepLineSeries.
Related tutorials
Demo source
<!-- Styles -->
<style>
#chartdiv {
  width: 100%;
  height: 500px;
}
</style>

<!-- Resources -->
<script src="https://cdn.amcharts.com/lib/5/index.js"></script>
<script src="https://cdn.amcharts.com/lib/5/xy.js"></script>
<script src="https://cdn.amcharts.com/lib/5/themes/Animated.js"></script>

<!-- Chart code -->
<script>
am5.ready(function() {

// Create root element
// https://www.amcharts.com/docs/v5/getting-started/#Root_element
var root = am5.Root.new("chartdiv");


// Set themes
// https://www.amcharts.com/docs/v5/concepts/themes/
root.setThemes([
  am5themes_Animated.new(root)
]);


// Create chart
// https://www.amcharts.com/docs/v5/charts/xy-chart/
var chart = root.container.children.push(am5xy.XYChart.new(root, {
  panX: false,
  panY: false,
  wheelX: "panX",
  wheelY: "zoomX",
  layout: root.verticalLayout
}));


// Add legend
// https://www.amcharts.com/docs/v5/charts/xy-chart/legend-xy-series/
var legend = chart.children.push(
  am5.Legend.new(root, {
    centerX: am5.p50,
    x: am5.p50
  })
);


// Create axes
// https://www.amcharts.com/docs/v5/charts/xy-chart/axes/
var xAxis = chart.xAxes.push(am5xy.ValueAxis.new(root, {
  min: 0,
  max: 100,
  renderer: am5xy.AxisRendererX.new(root, {})
}));

var yAxis = chart.yAxes.push(am5xy.ValueAxis.new(root, {
  min: 0,
  renderer: am5xy.AxisRendererY.new(root, {})
}));


// Add series
// https://www.amcharts.com/docs/v5/charts/xy-chart/series/
function createSeries(name, data) {
  var series = chart.series.push(am5xy.StepLineSeries.new(root, {
    name: name,
    xAxis: xAxis,
    yAxis: yAxis,
    baseAxis: xAxis,
    valueYField: "ay",
    valueXField: "ax",
    stacked: true
  }));

  series.strokes.template.setAll({
    strokeWidth: 3
  });

  series.fills.template.setAll({
    fillOpacity: 0.2,
    visible: true
  });

  series.data.setAll(data);

  // Make stuff animate on load
  // https://www.amcharts.com/docs/v5/concepts/animations/
  series.appear();

  var bulletSeries = chart.series.push(am5xy.ColumnSeries.new(root, {
    name: name,
    xAxis: xAxis,
    yAxis: yAxis,
    baseAxis: xAxis,
    valueYField: "ay",
    valueXField: "ax",
    stacked: true
  }));

  bulletSeries.columns.template.setAll({
    //width: 50,
    forceHidden: true
  });

  var bulletSeriesData = [];
  for(var i = 1; i < data.length; i++) {
    bulletSeriesData.push({
      "ax": data[i].ax - (data[i].ax - data[i-1].ax) / 2,
      "ay": data[i-1].ay
    })
  }

  bulletSeries.data.setAll(bulletSeriesData);

  bulletSeries.bullets.push(function () {
    return am5.Bullet.new(root, {
      locationX: 0.5,
      locationY: 0.5,
      sprite: am5.Label.new(root, {
        text: "{valueY}",
        centerY: am5.p50,
        centerX: am5.p50,
        populateText: true,
        background: am5.RoundedRectangle.new(root, {
          fill: root.interfaceColors.get("background")
        })
      })
    });
  });

  series.on("visible", function(visible, series) {
    if (visible) {
      bulletSeries.show();
    }
    else {
      bulletSeries.hide();
    }
  })

  legend.data.push(series);
}


var series1 = createSeries(
  "Trucks",
  [
    { "ax": 0, "ay": 20 },
    { "ax": 30, "ay": 10 },
    { "ax": 40, "ay": 35 },
    { "ax": 55, "ay": 43 },
    { "ax": 80, "ay": 33 },
    { "ax": 100, "ay": 33 }
  ]
);

var series2 = createSeries(
  "SUVs",
  [
    { "ax": 0, "ay": 10 },
    { "ax": 30, "ay": 39 },
    { "ax": 40, "ay": 22 },
    { "ax": 55, "ay": 26 },
    { "ax": 80, "ay": 15 },
    { "ax": 100, "ay": 15 }
  ]
);

var series3 = createSeries(
  "Cars",
  [
    { "ax": 0, "ay": 25 },
    { "ax": 30, "ay": 25 },
    { "ax": 40, "ay": 22 },
    { "ax": 55, "ay": 19 },
    { "ax": 80, "ay": 30 },
    { "ax": 100, "ay": 30 }
  ]
);


// Make stuff animate on load
// https://www.amcharts.com/docs/v5/concepts/animations/
chart.appear(1000, 100);

}); // end am5.ready()
</script>

<!-- HTML -->
<div id="chartdiv"></div>