AAPL
250%
ADBE
11.5%
ADSK
29.6%
AMD
9%
AMZN
16.4%
ATVI
8.8%
CRM
18.5%
CSCO
9.3%
COIN
33.9%
DELL
94.4%
DOCU
31%
EA
38.5%
EBAY
54.8%
FB
7.4%
GOOG
24%
HOOD
525%
IBM
155.6%
INTC
-6.6%
MSFT
21.1%
NET
88.2%
NFLX
7.7%
NVDA
92.3%
ORCL
1100%
PLTR
2.2%
PYPL
72%
ROKU
16.7%
SAP
22.8%
SHOP
17.1%
SNAP
60%
SONY
-1.2%
STX
-6.1%
T
69.6%
TSLA
21.9%
TSM
13.9%
TWTR
-16.7%
U
50%
UBER
3.2%
VMW
7.8%
WDC
-44.4%
ZM
31%
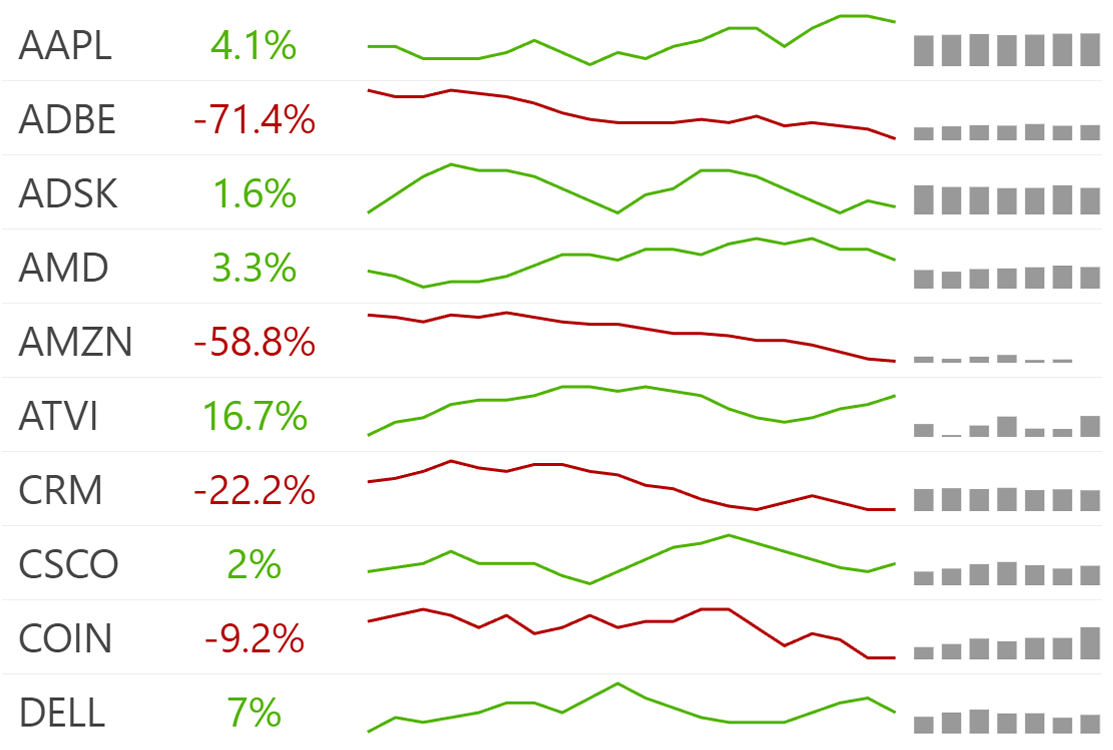
Micro Charts & Sparklines
Micro charts & sparklines give a quick representation of statistical information with no additional details and in a condensed space. They are typically drawn without axes and intended to be succinct, memorable, and located where they are discussed.
Related tutorials
Demo source
<!-- Styles -->
<style>
#chartdiv {
  width: 100%;
  height: 500px;
}
</style>

<!-- Resources -->
<script src="https://cdn.amcharts.com/lib/5/index.js"></script>
<script src="https://cdn.amcharts.com/lib/5/xy.js"></script>
<script src="https://cdn.amcharts.com/lib/5/themes/Micro.js"></script>

<!-- Chart code -->
<script>
am5.ready(function() {

var tickers = [
  "AAPL", "ADBE", "ADSK", "AMD", "AMZN", "ATVI", "CRM", "CSCO", "COIN", "DELL",
  "DOCU", "EA", "EBAY", "FB", "GOOG", "HOOD", "IBM", "INTC", "MSFT", "NET",
  "NFLX", "NVDA", "ORCL", "PLTR", "PYPL", "ROKU", "SAP", "SHOP", "SNAP",
  "SONY", "STX", "T", "TSLA", "TSM", "TWTR", "U", "UBER", "VMW", "WDC", "ZM"
];

for (var i = 0; i < tickers.length; i++) {
  var ticker = tickers[i];
  var positive = am5.color(0x50b300);
  var negative = am5.color(0xb30000);

  var data = generateData(20);
  var change = Math.round((data[data.length - 1].value / data[0].value - 1) * 1000) / 10;
  var color = change < 0 ? negative : positive;

  var div = document.getElementById("chartdiv");
  div.style.overflow = "auto";

  var row = document.createElement("div");
  row.style.borderBottom = "1px solid #eee";
  row.style.clear = "left";
  div.appendChild(row);

  var col1 = document.createElement("div");
  col1.innerHTML = ticker;
  col1.style.fontSize = "2em";
  col1.style.width = "10%";
  col1.style.padding = "0.2em 0.4em";
  col1.style.float = "left";
  row.appendChild(col1);

  var col2 = document.createElement("div");
  col2.innerHTML = change + "%";
  col2.style.fontSize = "2em";
  col2.style.width = "10%";
  col2.style.padding = "0.2em 0.4em";
  col2.style.float = "left";
  col2.style.color = color.toCSSHex();
  col2.style.textAlign = "center";
  row.appendChild(col2);

  var col3 = document.createElement("div");
  col3.style.fontSize = "2em";
  col3.style.width = "33%";
  col3.style.height = "35px";
  col3.style.padding = "0.2em 0.4em";
  col3.style.float = "left";
  row.appendChild(col3);
  createValueChart(col3, data, color);

  var col4 = document.createElement("div");
  col4.style.fontSize = "2em";
  col4.style.width = "33%";
  col4.style.height = "35px";
  col4.style.padding = "0.2em 0.4em";
  col4.style.float = "left";
  row.appendChild(col4);
  createVolumeChart(col4, data);
}

// Generate random data
function generateData(count) {
  var date = new Date();
  date.setHours(0, 0, 0, 0);
  var value = Math.ceil(Math.random() * 100);
  var volume = Math.ceil(Math.random() * 10000);

  var data = [];
  for (var i = 0; i < count; ++i) {
    value = Math.ceil((Math.random() * 6 - 3) + value);
    volume = Math.ceil((Math.random() * 1000 - 500) + volume);
    if (volume < 0) {
      volume = 0;
    }
    am5.time.add(date, "day", 1);
    data.push({
      date: date.getTime(),
      value: value,
      volume: volume
    });
  }
  return data;
}


function createValueChart(div, data, color) {
  var root = am5.Root.new(div);

  root.setThemes([
    am5themes_Micro.new(root)
  ]);

  var chart = root.container.children.push(am5xy.XYChart.new(root, {
    panX: false,
    panY: false,
    wheelX: "none",
    wheelY: "none"
  }));

  chart.plotContainer.set("wheelable", false);
  chart.zoomOutButton.set("forceHidden", true);

  var xAxis = chart.xAxes.push(am5xy.DateAxis.new(root, {
    maxDeviation: 0,
    baseInterval: { timeUnit: "day", count: 1 },
    renderer: am5xy.AxisRendererX.new(root, {})
  }));

  var yAxis = chart.yAxes.push(am5xy.ValueAxis.new(root, {
    strictMinMax: true,
    extraMax: 0.02,
    extraMin: 0.02,
    renderer: am5xy.AxisRendererY.new(root, {})
  }));


  var series = chart.series.push(am5xy.LineSeries.new(root, {
    xAxis: xAxis,
    yAxis: yAxis,
    valueYField: "value",
    valueXField: "date",
    stroke: color
  }));

  series.strokes.template.setAll({
    strokeWidth: 2
  });

  series.data.setAll(data);
}

function createVolumeChart(div, data) {
  var root = am5.Root.new(div);

  root.setThemes([
    am5themes_Micro.new(root)
  ]);

  var chart = root.container.children.push(am5xy.XYChart.new(root, {
    panX: false,
    panY: false,
    wheelX: "none",
    wheelY: "none"
  }));

  chart.plotContainer.set("wheelable", false);
  chart.zoomOutButton.set("forceHidden", true);

  var xAxis = chart.xAxes.push(am5xy.DateAxis.new(root, {
    maxDeviation: 0,
    baseInterval: { timeUnit: "day", count: 1 },
    renderer: am5xy.AxisRendererX.new(root, {})
  }));

  var yAxis = chart.yAxes.push(am5xy.ValueAxis.new(root, {
    renderer: am5xy.AxisRendererY.new(root, {})
  }));


  var series = chart.series.push(am5xy.ColumnSeries.new(root, {
    xAxis: xAxis,
    yAxis: yAxis,
    valueYField: "volume",
    valueXField: "date",
    fill: am5.color(0x999999)
  }));

  series.data.setAll(data);
}

}); // end am5.ready()
</script>

<!-- HTML -->
<div id="chartdiv"></div>