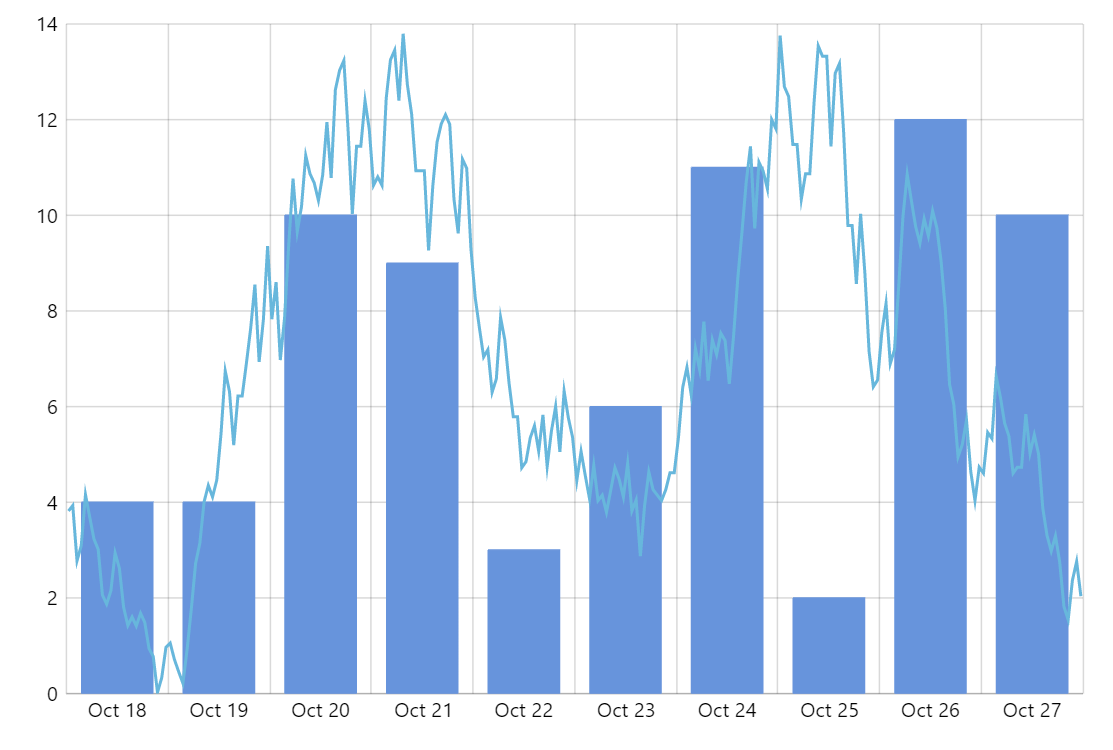
Mixed Daily and Intra-Day Chart
Displaying both daily and hourly data on the same chart is a great way to provide an overview high-level data and more granular details at a glance.
Key implementation details
The trick here is that we add two X axes (one for the hourly and for the daily data) and hide the labels and grid lines on the hourly one by setting forceHidden = true on both templates.
Related tutorials
Demo source
<!-- Styles -->
<style>
#chartdiv {
  width: 100%;
  height: 500px;
}
</style>

<!-- Resources -->
<script src="https://cdn.amcharts.com/lib/5/index.js"></script>
<script src="https://cdn.amcharts.com/lib/5/xy.js"></script>
<script src="https://cdn.amcharts.com/lib/5/themes/Animated.js"></script>

<!-- Chart code -->
<script>
am5.ready(function() {

// Create root element
// https://www.amcharts.com/docs/v5/getting-started/#Root_element
var root = am5.Root.new("chartdiv");

// Set themes
// https://www.amcharts.com/docs/v5/concepts/themes/
root.setThemes([
  am5themes_Animated.new(root)
]);

root.dateFormatter.setAll({
  dateFields: ["valueX"]
});

// Create chart
// https://www.amcharts.com/docs/v5/charts/xy-chart/
var chart = root.container.children.push(
  am5xy.XYChart.new(root, {
    focusable: true,
    panX: true,
    panY: true,
    wheelX: "panX",
    wheelY: "zoomX",
  pinchZoomX:true
  })
);

// Create line series and related axes
var xAxis1 = chart.xAxes.push(
  am5xy.DateAxis.new(root, {
    maxDeviation: 0.1,
    tooltipDateFormat: "MMM d, hh:00",
    baseInterval: { timeUnit: "hour", count: 1 },
    renderer: am5xy.AxisRendererX.new(root, {
      minGridDistance: 50,
      minorGridEnabled: true
    }),
    tooltip: am5.Tooltip.new(root, {})
  })
);

xAxis1.get("renderer").labels.template.set("forceHidden", true);
xAxis1.get("renderer").grid.template.set("forceHidden", true);

var yAxis1 = chart.yAxes.push(
  am5xy.ValueAxis.new(root, {
    maxDeviation: 0.1,
    renderer: am5xy.AxisRendererY.new(root, {})
  })
);

yAxis1.get("renderer").labels.template.set("forceHidden", true);
yAxis1.get("renderer").grid.template.set("forceHidden", true);

var series1 = chart.series.push(
  am5xy.LineSeries.new(root, {
    xAxis: xAxis1,
    yAxis: yAxis1,
    valueYField: "value",
    valueXField: "date",
    tooltip: am5.Tooltip.new(root, {
      pointerOrientation: "horizontal",
      labelText: "{valueY}"
    })
  })
);

series1.strokes.template.setAll({
  strokeWidth: 2
});

series1.data.setAll(generateHourlyData());

// Create column series and related axes
var xAxis2 = chart.xAxes.push(
  am5xy.DateAxis.new(root, {
    maxDeviation: 0.1,
    baseInterval: { timeUnit: "day", count: 1 },
    renderer: am5xy.AxisRendererX.new(root, {
      minGridDistance: 50
    })
  })
);

var yAxis2 = chart.yAxes.push(
  am5xy.ValueAxis.new(root, {
    maxDeviation: 0.1,
    renderer: am5xy.AxisRendererY.new(root, {})
  })
);

var series2 = chart.series.unshift(
  am5xy.ColumnSeries.new(root, {
    xAxis: xAxis2,
    yAxis: yAxis2,
    valueYField: "value",
    valueXField: "date",
    tooltip: am5.Tooltip.new(root, {
      pointerOrientation: "horizontal",
      labelText: "{valueY}"
    })
  })
);

series2.data.setAll(generateDailyData());

// Add cursor
// https://www.amcharts.com/docs/v5/charts/xy-chart/cursor/
var cursor = chart.set("cursor", am5xy.XYCursor.new(root, {
  xAxis: xAxis1
}));
cursor.lineY.set("visible", false);

// Make stuff animate on load
// https://www.amcharts.com/docs/v5/concepts/animations/
series1.appear(1000, 100);
series2.appear(1000, 100);
chart.appear(1000, 100);

// Functions to generate random data
function generateDailyData() {
  var firstDate = new Date();
  firstDate.setDate(firstDate.getDate() - 10);
  firstDate.setHours(0, 0, 0, 0);
  var data = [];
  for (var i = 0; i < 10; i++) {
    var newDate = new Date(firstDate);
    newDate.setDate(newDate.getDate() + i);
    data.push({
      date: newDate.getTime(),
      value: Math.round(Math.random() * 12) + 1
    });
  }
  return data;
}

function generateHourlyData() {
  var firstDate = new Date();
  firstDate.setDate(firstDate.getDate() - 10);
  var data = [];
  for (var i = 0; i < 10 * 24; i++) {
    var newDate = new Date(firstDate);
    newDate.setHours(newDate.getHours() + i, 0, 0);
    if (i == 0) {
      var value = Math.round(Math.random() * 10) + 1;
    } else {
      var value = Math.round(data[data.length - 1].value / 100 * (90 + Math.round(Math.random() * 20)) * 100) / 100;
    }
    data.push({
      date: newDate.getTime(),
      value: value
    });
  }
  return data;
}

}); // end am5.ready()
</script>

<!-- HTML -->
<div id="chartdiv"></div>