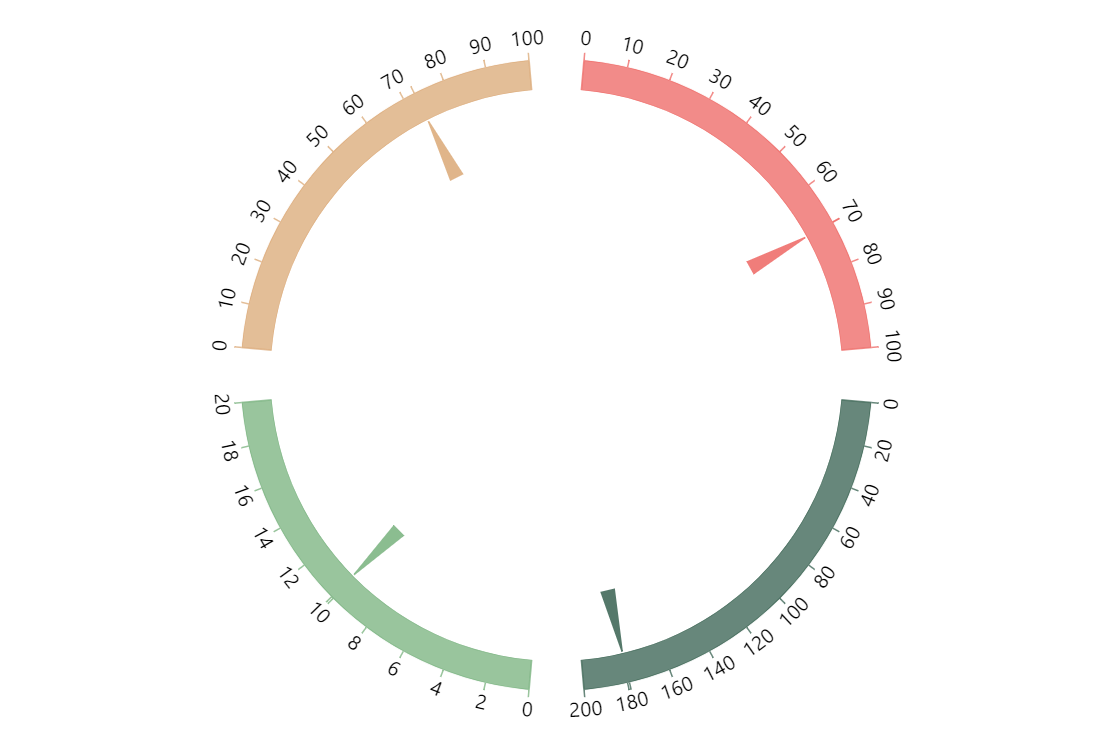
Multi-Part Gauge
You can use amCharts Gauge Chart to display multiple discreet values in one gauge. One way to do that is using multiple axes overlapping in a common space. The other is to have the parts occupy separate sections of the gauge.
Key implementation details
To create the axes for each quarter of the circle we create them using AxisRendererCircular renderer with startAngle and endAngle set to the specific section angles. Then we just create clock hands associated with each of the axes.
Related tutorials
Demo source
<!-- Styles -->
<style>
#chartdiv {
  width: 100%;
  height: 500px;
}
</style>

<!-- Resources -->
<script src="https://cdn.amcharts.com/lib/5/index.js"></script>
<script src="https://cdn.amcharts.com/lib/5/xy.js"></script>
<script src="https://cdn.amcharts.com/lib/5/radar.js"></script>
<script src="https://cdn.amcharts.com/lib/5/themes/Animated.js"></script>

<!-- Chart code -->
<script>
am5.ready(function() {

// Create root and chart
var root = am5.Root.new("chartdiv");

root.setThemes([
  am5themes_Animated.new(root)
]);

var chart = root.container.children.push(
  am5radar.RadarChart.new(root, {
    panX: false,
    panY: false,
    radius: am5.percent(90),
    innerRadius: -20
  })
);

function createAxis(min, max, start, end, color) {
  var axisRenderer = am5radar.AxisRendererCircular.new(root, {
    strokeOpacity: 0.1,
    minGridDistance: 30,
    startAngle: start,
    endAngle: end,
    stroke: color
  });

  axisRenderer.ticks.template.setAll({
    visible: true,
    strokeOpacity: 0.8,
    stroke: color
  });

  axisRenderer.grid.template.setAll({
    visible: false
  });

  var axis = chart.xAxes.push(
    am5xy.ValueAxis.new(root, {
      maxDeviation: 0,
      min: min,
      max: max,
      strictMinMax: true,
      renderer: axisRenderer
    })
  );


  var rangeDataItem = axis.makeDataItem({
    value: min,
    endValue: max
  });

  var range = axis.createAxisRange(rangeDataItem);

  rangeDataItem.get("axisFill").setAll({
    visible: true,
    fill: color,
    fillOpacity: 0.8,
    stroke: color,
    strokeOpacity: 0.8,
    strokeWidth: 1
  });

  rangeDataItem.get("tick").setAll({
    visible: false
  });

  return axis;
}

function createHand(axis) {
  var color = axis.get("renderer").get("stroke");
  var handDataItem = axis.makeDataItem({
    value: 0
  });

  var hand = handDataItem.set("bullet", am5xy.AxisBullet.new(root, {
    sprite: am5radar.ClockHand.new(root, {
      radius: am5.percent(90),
      innerRadius: am5.percent(70)
    })
  }));

  hand.get("sprite").pin.setAll({
    forceHidden: true
  });

  hand.get("sprite").hand.setAll({
    fill: color,
    fillOpacity: 0.9
  });

  axis.createAxisRange(handDataItem);

  return hand;
}

var axis1 = createAxis(0, 100, -85, -5, am5.color(0xEF6F6C));
var axis2 = createAxis(0, 200, 5, 85, am5.color(0x426A5A));
var axis3 = createAxis(0, 20, 95, 175, am5.color(0x7FB685));
var axis4 = createAxis(0, 100, 185, 265, am5.color(0xDDAE7E));

var hand1 = createHand(axis1);
var hand2 = createHand(axis2);
var hand3 = createHand(axis3);
var hand4 = createHand(axis4);

setInterval(function() {
  hand1.get("sprite").dataItem.animate({
    key: "value",
    to: Math.random() * hand1.axis.get("max"),
    duration: 800,
    easing: am5.ease.out(am5.ease.cubic)
  });

  hand2.get("sprite").dataItem.animate({
    key: "value",
    to: Math.random() * hand2.axis.get("max"),
    duration: 800,
    easing: am5.ease.out(am5.ease.cubic)
  });

  hand3.get("sprite").dataItem.animate({
    key: "value",
    to: Math.random() * hand3.axis.get("max"),
    duration: 800,
    easing: am5.ease.out(am5.ease.cubic)
  });

  hand4.get("sprite").dataItem.animate({
    key: "value",
    to: Math.random() * hand4.axis.get("max"),
    duration: 800,
    easing: am5.ease.out(am5.ease.cubic)
  });
}, 2000);

}); // end am5.ready()
</script>

<!-- HTML -->
<div id="chartdiv"></div>