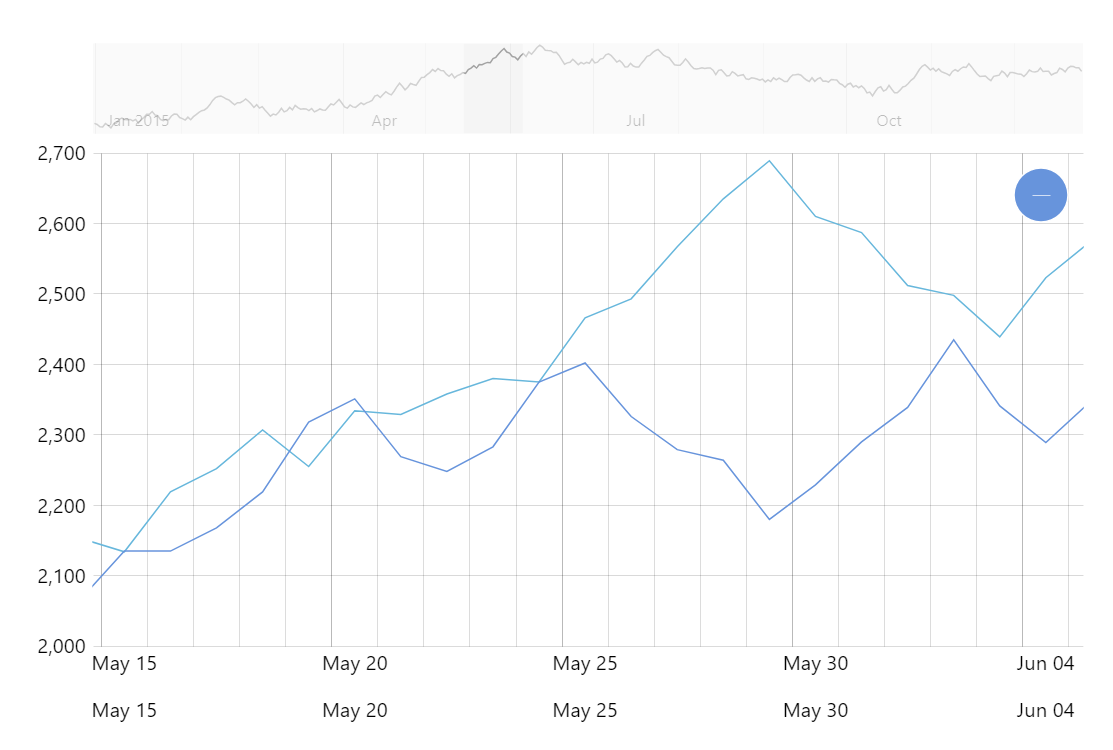
Multiple Date Axes
Just like you can have multiple value axes to address different ranges of values, you can also have multiple date axes in one XY chart. This could be useful when comparing data between current and previous periods, for example.
Key implementation details
Using multiple date axes is as straightforward as just adding two date axes to your chart’s xAxes in this (horizontal) scenario and then setting xAxis to the corresponding axis on each series.
Related tutorials
Demo source
<!-- Styles -->
<style>
#chartdiv {
  width: 100%;
  height: 500px;
}
</style>

<!-- Resources -->
<script src="https://cdn.amcharts.com/lib/5/index.js"></script>
<script src="https://cdn.amcharts.com/lib/5/xy.js"></script>
<script src="https://cdn.amcharts.com/lib/5/themes/Animated.js"></script>

<!-- Chart code -->
<script>
am5.ready(function() {

var data0 = [];
var data1 = [];

var price = 1000;
for (var i = 0; i < 360; i++) {
  price += Math.round((Math.random() < 0.5 ? 1 : -1) * Math.random() * 100);
  data0.push({ date: new Date(2015, 0, i).getTime(), price: price });
}

var price = 1200;
for (var i = 0; i < 360; i++) {
  price += Math.round((Math.random() < 0.5 ? 1 : -1) * Math.random() * 100);
  data1.push({ date: new Date(2017, 0, i).getTime(), price: price });
}

// Create root element
// https://www.amcharts.com/docs/v5/getting-started/#Root_element
var root = am5.Root.new("chartdiv");

// Set themes
// https://www.amcharts.com/docs/v5/concepts/themes/
root.setThemes([
  am5themes_Animated.new(root)
]);

// Create chart
// https://www.amcharts.com/docs/v5/charts/xy-chart/
var chart = root.container.children.push(
  am5xy.XYChart.new(root, {
    panX: false,
    panY: false,
    wheelX: "panX",
    wheelY: "zoomX"
  })
);

// Add cursor
// https://www.amcharts.com/docs/v5/charts/xy-chart/cursor/
var cursor = chart.set("cursor", am5xy.XYCursor.new(root, {
  behavior: "zoomX"
}));
cursor.lineY.set("visible", false);

// Create axes
// https://www.amcharts.com/docs/v5/charts/xy-chart/axes/
var xAxis0 = chart.xAxes.push(
  am5xy.DateAxis.new(root, {
    baseInterval: { timeUnit: "day", count: 1 },
    renderer: am5xy.AxisRendererX.new(root, {}),
    tooltip: am5.Tooltip.new(root, {}),
    tooltipDateFormat: "yyyy-MM-dd"
  })
);

var xAxis1 = chart.xAxes.push(
  am5xy.DateAxis.new(root, {
    marginTop: 10,
    baseInterval: { timeUnit: "day", count: 1 },
    renderer: am5xy.AxisRendererX.new(root, {}),
    tooltip: am5.Tooltip.new(root, {}),
    tooltipDateFormat: "yyyy-MM-dd"
  })
);

var yAxis = chart.yAxes.push(
  am5xy.ValueAxis.new(root, {
    renderer: am5xy.AxisRendererY.new(root, {})
  })
);

// Add series
// https://www.amcharts.com/docs/v5/charts/xy-chart/series/
var series0 = chart.series.push(
  am5xy.LineSeries.new(root, {
    name: "Series",
    xAxis: xAxis0,
    yAxis: yAxis,
    valueYField: "price",
    valueXField: "date",
    tooltip: am5.Tooltip.new(root, {
      labelText: "{valueY}"
    })
  })
);

var series1 = chart.series.push(
  am5xy.LineSeries.new(root, {
    name: "Series",
    xAxis: xAxis1,
    yAxis: yAxis,
    valueYField: "price",
    valueXField: "date",
    tooltip: am5.Tooltip.new(root, {
      labelText: "{valueY}"
    })
  })
);

// Add scrollbar
// https://www.amcharts.com/docs/v5/charts/xy-chart/scrollbars/
var scrollbar = chart.set("scrollbarX", am5xy.XYChartScrollbar.new(root, {
  orientation: "horizontal",
  height: 60
}));

var sbDateAxis = scrollbar.chart.xAxes.push(
  am5xy.DateAxis.new(root, {
    baseInterval: {
      timeUnit: "day",
      count: 1
    },
    renderer: am5xy.AxisRendererX.new(root, {})
  })
);

var sbValueAxis = scrollbar.chart.yAxes.push(
  am5xy.ValueAxis.new(root, {
    renderer: am5xy.AxisRendererY.new(root, {})
  })
);

var sbSeries = scrollbar.chart.series.push(
  am5xy.LineSeries.new(root, {
    valueYField: "price0",
    valueXField: "date0",
    xAxis: sbDateAxis,
    yAxis: sbValueAxis
  })
);

series0.data.setAll(data0);
series1.data.setAll(data1);
sbSeries.data.setAll(data0);

// Make stuff animate on load
// https://www.amcharts.com/docs/v5/concepts/animations/
series0.appear(1000);
series1.appear(1000);
chart.appear(1000, 100);

}); // end am5.ready()
</script>

<!-- HTML -->
<div id="chartdiv"></div>