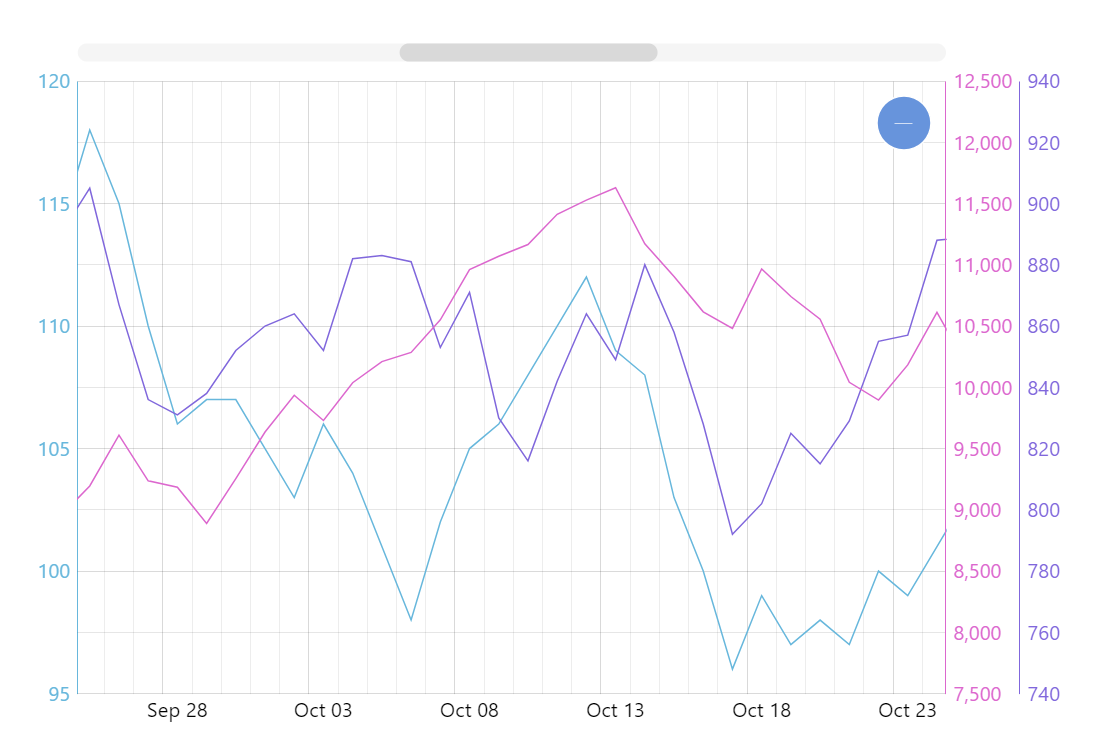
Multiple Value Axes
It’s very common to have multiple vastly different values yet want to be able to visually compare trends and relations between them. When you chart those values on the same scale you get mostly unusable results. But if you could map different graphs along different value axes you’d get a much better visualization. And amCharts has all the tools for you to achieve this. This demo shows you how.
Key implementation details
We can add as many axes as we need to the XY chart’s yAxes. Then when we add our line series we can specify which yAxis to assign it to. We can also specify that we want the axis to appear on the opposite side (opposite: true) of the plot area (the default being left side).
Related tutorials
Demo source
<!-- Styles -->
<style>
#chartdiv {
  width: 100%;
  height: 500px;
}
</style>

<!-- Resources -->
<script src="https://cdn.amcharts.com/lib/5/index.js"></script>
<script src="https://cdn.amcharts.com/lib/5/xy.js"></script>
<script src="https://cdn.amcharts.com/lib/5/themes/Animated.js"></script>

<!-- Chart code -->
<script>
am5.ready(function() {


// Create root element
// https://www.amcharts.com/docs/v5/getting-started/#Root_element
var root = am5.Root.new("chartdiv");

// Set themes
// https://www.amcharts.com/docs/v5/concepts/themes/
root.setThemes([
  am5themes_Animated.new(root)
]);

// Create chart
// https://www.amcharts.com/docs/v5/charts/xy-chart/
var chart = root.container.children.push(
  am5xy.XYChart.new(root, {
    focusable: true,
    panX: true,
    panY: true,
    wheelX: "panX",
    wheelY: "zoomX",
    pinchZoomX: true
  })
);

var easing = am5.ease.linear;
chart.get("colors").set("step", 3);

// Create axes
// https://www.amcharts.com/docs/v5/charts/xy-chart/axes/
var xAxis = chart.xAxes.push(
  am5xy.DateAxis.new(root, {
    maxDeviation: 0.1,
    groupData: false,
    baseInterval: {
      timeUnit: "day",
      count: 1
    },
    renderer: am5xy.AxisRendererX.new(root, {
      minGridDistance: 80,
      minorGridEnabled: true
    }),
    tooltip: am5.Tooltip.new(root, {})
  })
);

function createAxisAndSeries(startValue, opposite) {
  var yRenderer = am5xy.AxisRendererY.new(root, {
    opposite: opposite
  });
  var yAxis = chart.yAxes.push(
    am5xy.ValueAxis.new(root, {
      maxDeviation: 1,
      renderer: yRenderer
    })
  );

  if (chart.yAxes.indexOf(yAxis) > 0) {
    yAxis.set("syncWithAxis", chart.yAxes.getIndex(0));
  }

  // Add series
  // https://www.amcharts.com/docs/v5/charts/xy-chart/series/
  var series = chart.series.push(
    am5xy.LineSeries.new(root, {
      xAxis: xAxis,
      yAxis: yAxis,
      valueYField: "value",
      valueXField: "date",
      tooltip: am5.Tooltip.new(root, {
        pointerOrientation: "horizontal",
        labelText: "{valueY}"
      })
    })
  );

  //series.fills.template.setAll({ fillOpacity: 0.2, visible: true });
  series.strokes.template.setAll({ strokeWidth: 1 });

  yRenderer.grid.template.set("strokeOpacity", 0.05);
  yRenderer.labels.template.set("fill", series.get("fill"));
  yRenderer.setAll({
    stroke: series.get("fill"),
    strokeOpacity: 1,
    opacity: 1
  });

  // Set up data processor to parse string dates
  // https://www.amcharts.com/docs/v5/concepts/data/#Pre_processing_data
  series.data.processor = am5.DataProcessor.new(root, {
    dateFormat: "yyyy-MM-dd",
    dateFields: ["date"]
  });

  series.data.setAll(generateChartData(startValue));
}

// Add cursor
// https://www.amcharts.com/docs/v5/charts/xy-chart/cursor/
var cursor = chart.set("cursor", am5xy.XYCursor.new(root, {
  xAxis: xAxis,
  behavior: "none"
}));
cursor.lineY.set("visible", false);

// add scrollbar
chart.set("scrollbarX", am5.Scrollbar.new(root, {
  orientation: "horizontal"
}));

createAxisAndSeries(100, false);
createAxisAndSeries(1000, true);
createAxisAndSeries(8000, true);

// Make stuff animate on load
// https://www.amcharts.com/docs/v5/concepts/animations/
chart.appear(1000, 100);

// Generates random data, quite different range
function generateChartData(value) {
  var data = [];
  var firstDate = new Date();
  firstDate.setDate(firstDate.getDate() - 100);
  firstDate.setHours(0, 0, 0, 0);

  for (var i = 0; i < 100; i++) {
    var newDate = new Date(firstDate);
    newDate.setDate(newDate.getDate() + i);

    value += Math.round(
      ((Math.random() < 0.5 ? 1 : -1) * Math.random() * value) / 20
    );

    data.push({
      date: newDate,
      value: value
    });
  }
  return data;
}

}); // end am5.ready()
</script>

<!-- HTML -->
<div id="chartdiv"></div>