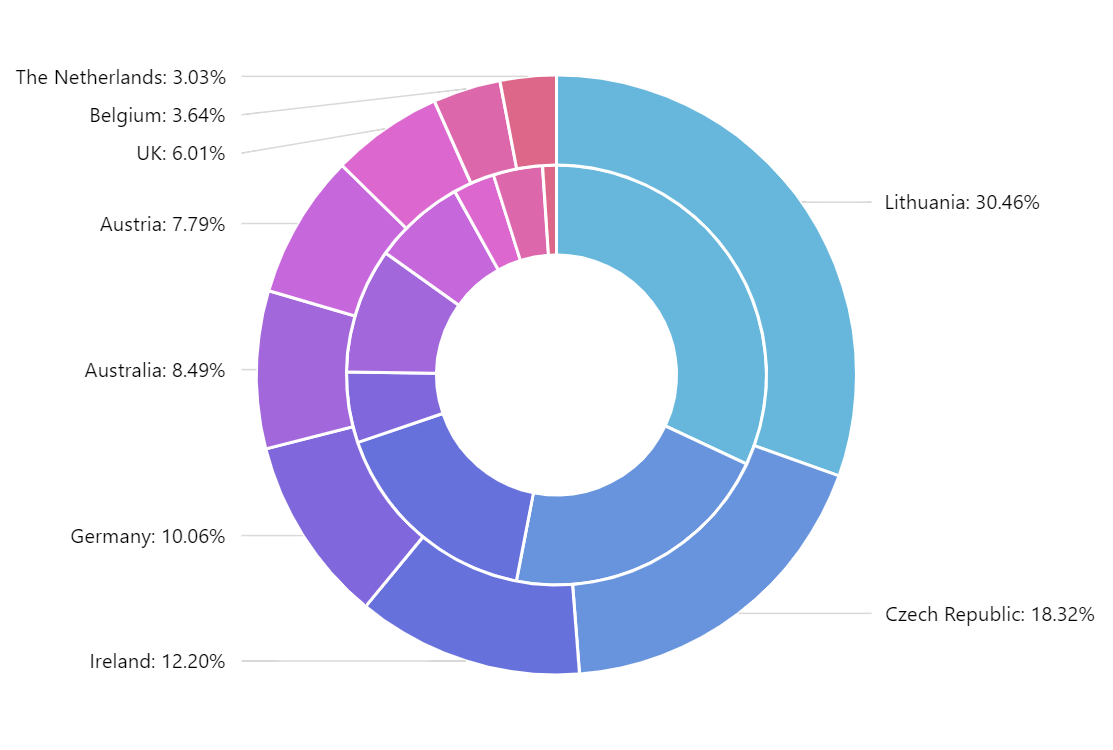
Nested Donut Chart
Nested donut chart (also known as Multi-level doughnut chart, Multi-series doughnut chart) allows you to display multiple series in a single visualization. The series are usually related but represent different categories or slices of data (like the distribution of some category values over different years, etc.)
Support for multiple series
You can add any number of pie series to the pie chart. The chart will automatically nest them dividing available radius between each series, creating nested donuts.
More about nested donut charts
Demo source
<!-- Styles -->
<style>
#chartdiv {
  width: 100%;
  height: 500px;
}
</style>

<!-- Resources -->
<script src="https://cdn.amcharts.com/lib/5/index.js"></script>
<script src="https://cdn.amcharts.com/lib/5/percent.js"></script>
<script src="https://cdn.amcharts.com/lib/5/themes/Animated.js"></script>

<!-- Chart code -->
<script>
am5.ready(function() {

// Create root element
// https://www.amcharts.com/docs/v5/getting-started/#Root_element
var root = am5.Root.new("chartdiv");

// Set themes
// https://www.amcharts.com/docs/v5/concepts/themes/
root.setThemes([
  am5themes_Animated.new(root)
]);

// Create chart
// https://www.amcharts.com/docs/v5/charts/percent-charts/pie-chart/
// start and end angle must be set both for chart and series
var chart = root.container.children.push(am5percent.PieChart.new(root, {
  layout: root.verticalLayout,
  innerRadius: am5.percent(40)
}));

// Create series
// https://www.amcharts.com/docs/v5/charts/percent-charts/pie-chart/#Series
// start and end angle must be set both for chart and series
var series0 = chart.series.push(am5percent.PieSeries.new(root, {
  valueField: "bottles",
  categoryField: "country",
  alignLabels: false
}));

var bgColor = root.interfaceColors.get("background");

series0.ticks.template.setAll({ forceHidden: true });
series0.labels.template.setAll({ forceHidden: true });
series0.slices.template.setAll({
  stroke: bgColor,
  strokeWidth: 2,
  tooltipText:
    "{category}: {valuePercentTotal.formatNumber('0.00')}% ({value} bottles)"
});
series0.slices.template.states.create("hover", { scale: 0.95 });

var series1 = chart.series.push(am5percent.PieSeries.new(root, {
  valueField: "litres",
  categoryField: "country",
  alignLabels: true
}));

series1.slices.template.setAll({
  stroke: bgColor,
  strokeWidth: 2,
  tooltipText:
    "{category}: {valuePercentTotal.formatNumber('0.00')}% ({value} litres)"
});

var data = [{
  country: "Lithuania",
  litres: 501.9,
  bottles: 1500
}, {
  country: "Czech Republic",
  litres: 301.9,
  bottles: 990
}, {
  country: "Ireland",
  litres: 201.1,
  bottles: 785
}, {
  country: "Germany",
  litres: 165.8,
  bottles: 255
}, {
  country: "Australia",
  litres: 139.9,
  bottles: 452
}, {
  country: "Austria",
  litres: 128.3,
  bottles: 332
}, {
  country: "UK",
  litres: 99,
  bottles: 150
}, {
  country: "Belgium",
  litres: 60,
  bottles: 178
}, {
  country: "The Netherlands",
  litres: 50,
  bottles: 50
}];

// Set data
// https://www.amcharts.com/docs/v5/charts/percent-charts/pie-chart/#Setting_data
series0.data.setAll(data);
series1.data.setAll(data);

// Play initial series animation
// https://www.amcharts.com/docs/v5/concepts/animations/#Animation_of_series
series0.appear(1000, 100);
series1.appear(1000, 100);

}); // end am5.ready()
</script>

<!-- HTML -->
<div id="chartdiv"></div>