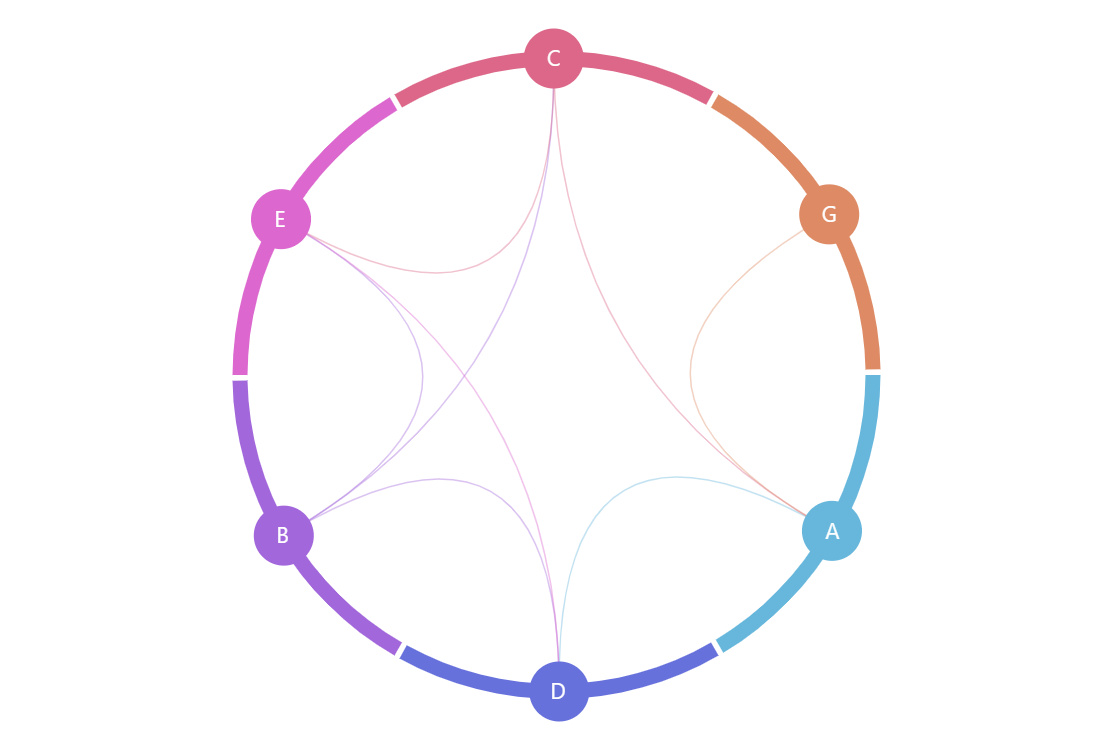
Non-Ribbon Chord diagram
Compared to traditional Chord diagrams, Non-ribbon chord diagrams emphasize the connections between data points rather than additional properties of those connections.
amCharts 5 includes powerful tools to create your own interactive Chord diagrams and other Flow charts.
Demo source
<!-- Styles -->
<style>
#chartdiv {
  width: 100%;
  height: 500px;
}
</style>

<!-- Resources -->
<script src="https://cdn.amcharts.com/lib/5/index.js"></script>
<script src="https://cdn.amcharts.com/lib/5/flow.js"></script>
<script src="https://cdn.amcharts.com/lib/5/themes/Animated.js"></script>

<!-- Chart code -->
<script>
am5.ready(function() {

// Create root element
// https://www.amcharts.com/docs/v5/getting-started/#Root_element
var root = am5.Root.new("chartdiv");


// Set themes
// https://www.amcharts.com/docs/v5/concepts/themes/
root.setThemes([
  am5themes_Animated.new(root)
]);


// Create series
// https://www.amcharts.com/docs/v5/charts/flow-charts/
var series = root.container.children.push(am5flow.ChordNonRibbon.new(root, {
  sourceIdField: "from",
  targetIdField: "to",
  valueField: "value"
}));

series.nodes.get("colors").set("step", 2);

series.bullets.push(function (_root, _series, dataItem) {
  var bullet = am5.Bullet.new(root, {
    locationY: Math.random(),
    sprite: am5.Circle.new(root, {
      radius: 5,
      fill: dataItem.get("source").get("fill")
    })
  });

  bullet.animate({
    key: "locationY",
    to: 1,
    from: 0,
    duration: Math.random() * 1000 + 2000,
    loops: Infinity,
    easing: am5.ease.yoyo(am5.ease.cubic)
  });

  return bullet;
});

series.nodes.labels.template.setAll({
  textType: "regular",
  fill: root.interfaceColors.get("background"),
  fontSize: "1.1em",
  radius: -5
});

series.nodes.bullets.push(function (_root, _series, dataItem) {
  return am5.Bullet.new(root, {
    sprite: am5.Circle.new(root, {
      radius: 20,
      fill: dataItem.get("fill")
    })
  });
});

series.children.moveValue(series.bulletsContainer, 0);


// Set data
// https://www.amcharts.com/docs/v5/charts/flow-charts/#Setting_data
series.data.setAll([
  { from: "A", to: "D", value: 10 },
  { from: "B", to: "D", value: 8 },
  { from: "B", to: "E", value: 4 },
  { from: "B", to: "C", value: 2 },
  { from: "C", to: "E", value: 14 },
  { from: "E", to: "D", value: 8 },
  { from: "C", to: "A", value: 4 },
  { from: "G", to: "A", value: 7 }
]);


// Make stuff animate on load
series.appear(1000, 100);

}); // end am5.ready()
</script>

<!-- HTML -->
<div id="chartdiv"></div>