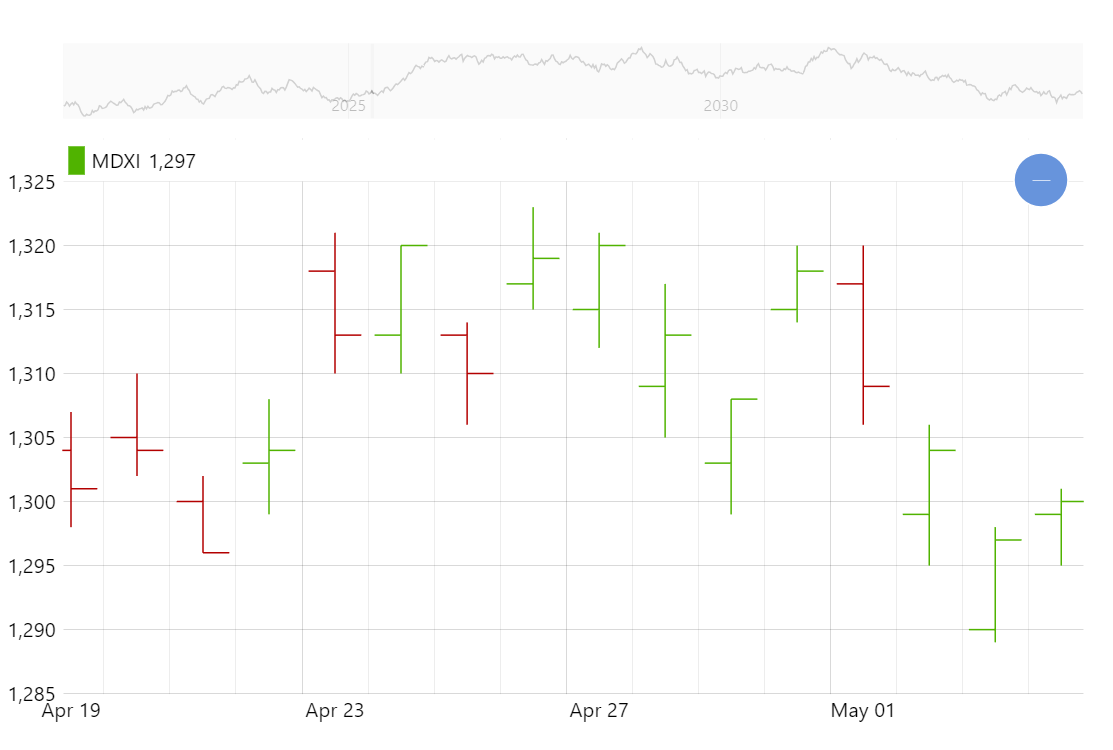
OHLC Chart
The OHLC chart is a very popular way to display financial (and other) data over time with open, high, low, and close values for periods.
Key implementation details
To create an OHLC chart we add OHLCSeries to our XY Chart and setup its open, high, low, and close fields.
Related tutorials
Demo source
<!-- Styles -->
<style>
#chartdiv {
  width: 100%;
  height: 500px;
max-width: 100%
}
</style>

<!-- Resources -->
<script src="https://cdn.amcharts.com/lib/5/index.js"></script>
<script src="https://cdn.amcharts.com/lib/5/xy.js"></script>
<script src="https://cdn.amcharts.com/lib/5/themes/Animated.js"></script>

<!-- Chart code -->
<script>
am5.ready(function() {

// Create root element
// https://www.amcharts.com/docs/v5/getting-started/#Root_element
var root = am5.Root.new("chartdiv");

const myTheme = am5.Theme.new(root);

myTheme.rule("Grid", ["scrollbar", "minor"]).setAll({
  visible:false
});

root.setThemes([
  am5themes_Animated.new(root),
  myTheme
]);
function generateChartData() {
  var chartData = [];
  var firstDate = new Date();
  firstDate.setDate(firstDate.getDate() - 2000);
  firstDate.setHours(0, 0, 0, 0);
  var value = 1200;
  for (var i = 0; i < 2000; i++) {
    var newDate = new Date(firstDate);
    newDate.setDate(newDate.getDate() + i);

    value += Math.round((Math.random() < 0.5 ? 1 : -1) * Math.random() * 10);
    var open = value + Math.round(Math.random() * 16 - 8);
    var low = Math.min(value, open) - Math.round(Math.random() * 5);
    var high = Math.max(value, open) + Math.round(Math.random() * 5);

    chartData.push({
      date: newDate.getTime(),
      value: value,
      open: open,
      low: low,
      high: high,
    });
  }
  return chartData;
}

var data = generateChartData();


// Create chart
// https://www.amcharts.com/docs/v5/charts/xy-chart/
var chart = root.container.children.push(am5xy.XYChart.new(root, {
  focusable: true,
  panX: true,
  panY: true,
  wheelX: "panX",
  wheelY: "zoomX",
  paddingLeft: 0
}));


// Create axes
// https://www.amcharts.com/docs/v5/charts/xy-chart/axes/
var xAxis = chart.xAxes.push(am5xy.DateAxis.new(root, {
  maxDeviation: 0.5,
  groupData: true,
  baseInterval: { timeUnit: "day", count: 1 },
  renderer: am5xy.AxisRendererX.new(root, {
    pan: "zoom",
    minorGridEnabled: true
  }),
  tooltip: am5.Tooltip.new(root, {})
}));

var yAxis = chart.yAxes.push(am5xy.ValueAxis.new(root, {
  maxDeviation: 1,
  renderer: am5xy.AxisRendererY.new(root, {
    pan: "zoom"
  })
}));


var color = root.interfaceColors.get("background");


// Add series
// https://www.amcharts.com/docs/v5/charts/xy-chart/series/
var series = chart.series.push(am5xy.OHLCSeries.new(root, {
  fill: color,
  calculateAggregates: true,
  stroke: color,
  name: "MDXI",
  xAxis: xAxis,
  yAxis: yAxis,
  valueYField: "value",
  openValueYField: "open",
  lowValueYField: "low",
  highValueYField: "high",
  valueXField: "date",
  lowValueYGrouped: "low",
  highValueYGrouped: "high",
  openValueYGrouped: "open",
  valueYGrouped: "close",
  legendValueText: "open: {openValueY} low: {lowValueY} high: {highValueY} close: {valueY}",
  legendRangeValueText: "{valueYClose}",
  tooltip: am5.Tooltip.new(root, {
    pointerOrientation: "horizontal",
    labelText: "open: {openValueY}\nlow: {lowValueY}\nhigh: {highValueY}\nclose: {valueY}"
  })
}));


// Add cursor
// https://www.amcharts.com/docs/v5/charts/xy-chart/cursor/
var cursor = chart.set("cursor", am5xy.XYCursor.new(root, {
  xAxis: xAxis
}));
cursor.lineY.set("visible", false);


// Stack axes vertically
// https://www.amcharts.com/docs/v5/charts/xy-chart/axes/#Stacked_axes
chart.leftAxesContainer.set("layout", root.verticalLayout);


// Add scrollbar
// https://www.amcharts.com/docs/v5/charts/xy-chart/scrollbars/
var scrollbar = am5xy.XYChartScrollbar.new(root, {
  orientation: "horizontal",
  height: 50
});
chart.set("scrollbarX", scrollbar);

var sbxAxis = scrollbar.chart.xAxes.push(am5xy.DateAxis.new(root, {
  groupData: true,
  groupIntervals: [{ timeUnit: "week", count: 1 }],
  baseInterval: { timeUnit: "day", count: 1 },
  renderer: am5xy.AxisRendererX.new(root, {
    minorGridEnabled: true,
    strokeOpacity: 0
  })
}));

var sbyAxis = scrollbar.chart.yAxes.push(am5xy.ValueAxis.new(root, {
  renderer: am5xy.AxisRendererY.new(root, {
    minorGridEnabled: true
  })
}));

var sbseries = scrollbar.chart.series.push(am5xy.LineSeries.new(root, {
  xAxis: sbxAxis,
  yAxis: sbyAxis,
  valueYField: "value",
  valueXField: "date"
}));

// Add legend
// https://www.amcharts.com/docs/v5/charts/xy-chart/legend-xy-series/
var legend = yAxis.axisHeader.children.push(
  am5.Legend.new(root, {})
);

legend.data.push(series);

legend.markers.template.setAll({
  width: 10
});

legend.markerRectangles.template.setAll({
  cornerRadiusTR: 0,
  cornerRadiusBR: 0,
  cornerRadiusTL: 0,
  cornerRadiusBL: 0
});

series.data.setAll(data);
sbseries.data.setAll(data);

// Make stuff animate on load
// https://www.amcharts.com/docs/v5/concepts/animations/
series.appear(1000);
chart.appear(1000, 100);

}); // end am5.ready()
</script>

<!-- HTML -->
<div id="chartdiv"></div>