Select data granularity
On-Demand Data Loading
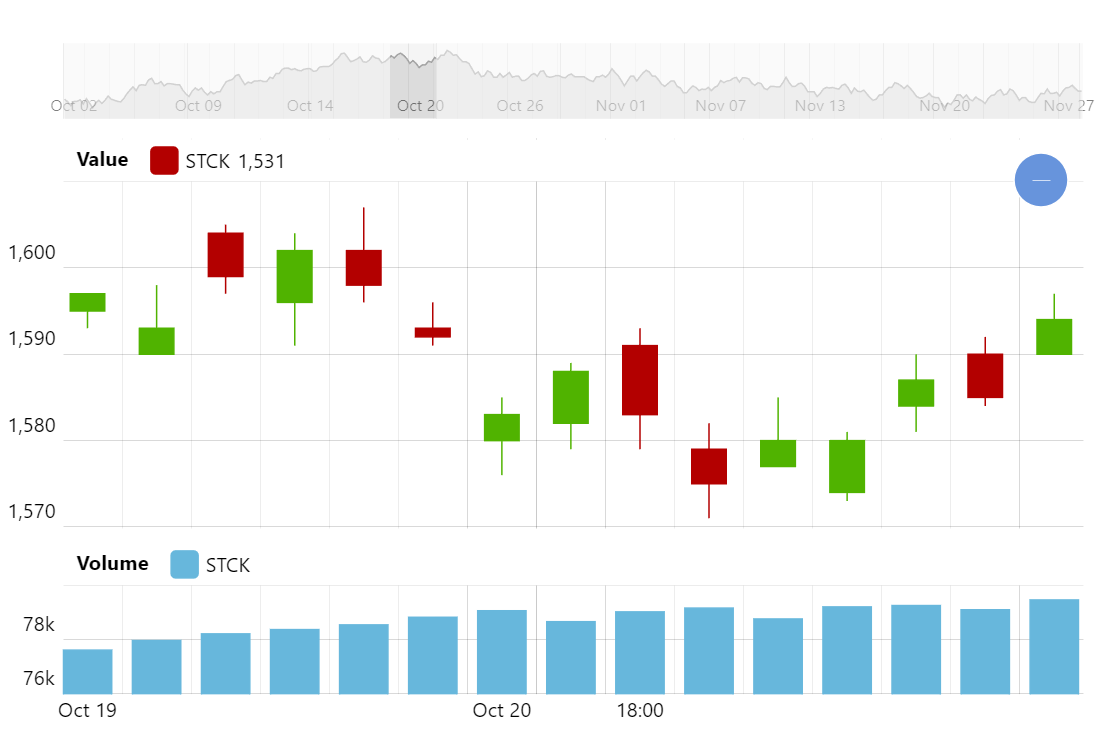
This demo shows a sample Stock chart setup which can load its data on-demand.
Try panning the chart chart, zooming, switching granularity. The code will gracefully handle loading missing data from the backend.
It relies on a few of the technologies implemented in amCharts 5:
- Incremental data loading
- CSV data loading and parsing
- Stacked axes
Related tutorials
- Incremental on-demand data loading (commentary about the code behind this demo)
- Stacked axes
- XY chart
Demo source
<!-- Styles -->
<style>
#chartdiv {
  width: 100%;
  height: 500px;
  max-width: 100%;
}

#tools {
  padding: 0.3em 1em;
  text-align: right;
  max-width: 100%;
}

#tools input.active {
  font-weight: bold;
}
</style>

<!-- Resources -->
<script src="https://cdn.amcharts.com/lib/5/index.js"></script>
<script src="https://cdn.amcharts.com/lib/5/xy.js"></script>
<script src="https://cdn.amcharts.com/lib/5/themes/Animated.js"></script>

<!-- Chart code -->
<script>
am5.ready(function() {

// =========================================================
// Setting up the chart
// =========================================================

// Create root element
// https://www.amcharts.com/docs/v5/getting-started/#Root_element
var root = am5.Root.new("chartdiv");

const myTheme = am5.Theme.new(root);

myTheme.rule("Grid", ["scrollbar", "minor"]).setAll({
  visible:false
});

root.setThemes([
  am5themes_Animated.new(root),
  myTheme
]);


// Create chart
// https://www.amcharts.com/docs/v5/charts/xy-chart/
var chart = root.container.children.push(am5xy.XYChart.new(root, {
  panX: true,
  panY: false,
  wheelX: "panX",
  wheelY: "zoomX",
  layout: root.verticalLayout,
  pinchZoomX: true,
  paddingLeft: 0
}));

chart.get("colors").set("step", 2);


// Create axes
// https://www.amcharts.com/docs/v5/charts/xy-chart/axes/
var valueAxis = chart.yAxes.push(am5xy.ValueAxis.new(root, {
  renderer: am5xy.AxisRendererY.new(root, {
    pan: "zoom"
  }),
  height: am5.percent(70)
}));

valueAxis.get("renderer").labels.template.setAll({
  centerY: am5.percent(100),
  maxPosition: 0.98
});

valueAxis.axisHeader.children.push(am5.Label.new(root, {
  text: "Value",
  fontWeight: "bold",
  paddingBottom: 5,
  paddingTop: 5
}));

var volumeAxis = chart.yAxes.push(am5xy.ValueAxis.new(root, {
  renderer: am5xy.AxisRendererY.new(root, {
    pan: "zoom"
  }),
  height: am5.percent(30),
  layer: 5,
  numberFormat: "#a"
}));

volumeAxis.get("renderer").labels.template.setAll({
  centerY: am5.percent(100),
  maxPosition: 0.98
});

volumeAxis.axisHeader.set("paddingTop", 10);
volumeAxis.axisHeader.children.push(am5.Label.new(root, {
  text: "Volume",
  fontWeight: "bold",
  paddingTop: 5,
  paddingBottom: 5
}));


var dateAxis = chart.xAxes.push(am5xy.GaplessDateAxis.new(root, {
  maxDeviation: 1,
  baseInterval: { timeUnit: "day", count: 1 },
  renderer: am5xy.AxisRendererX.new(root, {
    minorGridEnabled: true,
    pan: "zoom"
  }),
  tooltip: am5.Tooltip.new(root, {})
}));

dateAxis.get("renderer").labels.template.setAll({
  minPosition: 0.01,
  maxPosition: 0.99
});

var color = root.interfaceColors.get("background");

// Add series
// https://www.amcharts.com/docs/v5/charts/xy-chart/series/
var valueSeries = chart.series.push(
  am5xy.CandlestickSeries.new(root, {
    fill: color,
    clustered: false,
    calculateAggregates: true,
    stroke: color,
    name: "STCK",
    xAxis: dateAxis,
    yAxis: valueAxis,
    valueYField: "close",
    openValueYField: "open",
    lowValueYField: "low",
    highValueYField: "high",
    valueXField: "date",
    lowValueYGrouped: "low",
    highValueYGrouped: "high",
    openValueYGrouped: "open",
    valueYGrouped: "close",
    legendValueText: "open: {openValueY} low: {lowValueY} high: {highValueY} close: {valueY}",
    legendRangeValueText: "{valueYClose}"
  })
);

var valueTooltip = valueSeries.set("tooltip", am5.Tooltip.new(root, {
  getFillFromSprite: false,
  getStrokeFromSprite: true,
  getLabelFillFromSprite: true,
  autoTextColor: false,
  pointerOrientation: "horizontal",
  labelText: "{name}: {valueY} {valueYChangePreviousPercent.formatNumber('[#00ff00]+#,###.##|[#ff0000]#,###.##|[#999999]0')}%"
}));
valueTooltip.get("background").set("fill", root.interfaceColors.get("background"));


var firstColor = chart.get("colors").getIndex(0);
var volumeSeries = chart.series.push(am5xy.ColumnSeries.new(root, {
  name: "STCK",
  clustered: false,
  fill: firstColor,
  stroke: firstColor,
  valueYField: "volume",
  valueXField: "date",
  valueYGrouped: "sum",
  xAxis: dateAxis,
  yAxis: volumeAxis,
  legendValueText: "{valueY}",
  tooltip: am5.Tooltip.new(root, {
    labelText: "{valueY}"
  })
}));

//volumeSeries.columns.template.setAll({
//strokeWidth: 0.5,
//strokeOpacity: 1,
//stroke: am5.color(0xffffff)
//});


// Add legend to axis header
// https://www.amcharts.com/docs/v5/charts/xy-chart/axes/axis-headers/
// https://www.amcharts.com/docs/v5/charts/xy-chart/legend-xy-series/
var valueLegend = valueAxis.axisHeader.children.push(
  am5.Legend.new(root, {
    useDefaultMarker: true
  })
);
valueLegend.data.setAll([valueSeries]);

var volumeLegend = volumeAxis.axisHeader.children.push(
  am5.Legend.new(root, {
    useDefaultMarker: true
  })
);
volumeLegend.data.setAll([volumeSeries]);


// Stack axes vertically
// https://www.amcharts.com/docs/v5/charts/xy-chart/axes/#Stacked_axes
chart.leftAxesContainer.set("layout", root.verticalLayout);


// Add cursor
// https://www.amcharts.com/docs/v5/charts/xy-chart/cursor/
chart.set("cursor", am5xy.XYCursor.new(root, {}))


// Add scrollbar
// https://www.amcharts.com/docs/v5/charts/xy-chart/scrollbars/
var scrollbar = chart.set("scrollbarX", am5xy.XYChartScrollbar.new(root, {
  orientation: "horizontal",
  height: 50
}));

var sbDateAxis = scrollbar.chart.xAxes.push(am5xy.GaplessDateAxis.new(root, {
  baseInterval: {
    timeUnit: "day",
    count: 1
  },
  renderer: am5xy.AxisRendererX.new(root, {
    minorGridEnabled: true
  })
}));

var sbValueAxis = scrollbar.chart.yAxes.push(
  am5xy.ValueAxis.new(root, {
    renderer: am5xy.AxisRendererY.new(root, {})
  })
);

var sbSeries = scrollbar.chart.series.push(am5xy.LineSeries.new(root, {

  valueYField: "close",
  valueXField: "date",
  xAxis: sbDateAxis,
  yAxis: sbValueAxis
}));

sbSeries.fills.template.setAll({
  visible: true,
  fillOpacity: 0.3
});


// =========================================================
// Data loading
// =========================================================

// actual data loading and handling when it is loaded
function loadData(unit, min, max, side) {

  // round min so that selected unit would be included
  min = am5.time.round(new Date(min), unit, 1).getTime();

  // Load external data
  // https://www.amcharts.com/docs/v5/charts/xy-chart/series/#Setting_data
  var url = "https://www.amcharts.com/tools/data/?unit=" + unit + "&start=" + min + "&end=" + max;

  // Handle loaded data
  am5.net.load(url).then(function (result) {

    // Parse loaded data
    var data = am5.CSVParser.parse(result.response, {
      delimiter: ",",
      reverse: false,
      skipEmpty: true,
      useColumnNames: true
    });

    // Process data (convert dates and values)
    var processor = am5.DataProcessor.new(root, {
      numericFields: ["date", "open", "high", "low", "close", "volume"]
    });
    processor.processMany(data);

    var start = dateAxis.get("start");
    var end = dateAxis.get("end");

    // will hold first/last dates of each series
    var seriesFirst = {};
    var seriesLast = {};

    // Set data
    if (side == "none") {
      if (data.length > 0) {
        // change base interval if it's different
        if (dateAxis.get("baseInterval").timeUnit != unit) {
          dateAxis.set("baseInterval", { timeUnit: unit, count: 1 });
          sbDateAxis.set("baseInterval", { timeUnit: unit, count: 1 });
        }

        dateAxis.set("min", min);
        dateAxis.set("max", max);
        dateAxis.setPrivate("min", min);   // needed in order not to animate
        dateAxis.setPrivate("max", max);   // needed in order not to animate

        valueSeries.data.setAll(data);
        volumeSeries.data.setAll(data);
        sbSeries.data.setAll(data);

        dateAxis.zoom(0, 1, 0);
      }
    }
    else if (side == "left") {
      // save dates of first items so that duplicates would not be added
      seriesFirst[valueSeries.uid] = valueSeries.data.getIndex(0).date;
      seriesFirst[volumeSeries.uid] = volumeSeries.data.getIndex(0).date;
      seriesFirst[sbSeries.uid] = sbSeries.data.getIndex(0).date;

      for (var i = data.length - 1; i >= 0; i--) {
        var date = data[i].date;
        // only add if first items date is bigger then newly added items date
        if (seriesFirst[valueSeries.uid] > date) {
          valueSeries.data.unshift(data[i]);
        }
        if (seriesFirst[volumeSeries.uid] > date) {
          volumeSeries.data.unshift(data[i]);
        }
        if (seriesFirst[sbSeries.uid] > date) {
          sbSeries.data.unshift(data[i]);
        }
      }

      // update axis min
      min = Math.max(min, absoluteMin);
      dateAxis.set("min", min);
      dateAxis.setPrivate("min", min); // needed in order not to animate
      // recalculate start and end so that the selection would remain
      dateAxis.set("start", 0);
      dateAxis.set("end", (end - start) / (1 - start));
    }
    else if (side == "right") {
      // save dates of last items so that duplicates would not be added
      seriesLast[valueSeries.uid] = valueSeries.data.getIndex(valueSeries.data.length - 1).date;
      seriesLast[volumeSeries.uid] = volumeSeries.data.getIndex(volumeSeries.data.length - 1).date;
      seriesLast[sbSeries.uid] = sbSeries.data.getIndex(sbSeries.data.length - 1).date;

      for (var i = 0; i < data.length; i++) {
        var date = data[i].date;
        // only add if last items date is smaller then newly added items date
        if (seriesLast[valueSeries.uid] < date) {
          valueSeries.data.push(data[i]);
        }
        if (seriesLast[volumeSeries.uid] < date) {
          volumeSeries.data.push(data[i]);
        }
        if (seriesLast[sbSeries.uid] < date) {
          sbSeries.data.push(data[i]);
        }
      }
      // update axis max
      max = Math.min(max, absoluteMax);
      dateAxis.set("max", max);
      dateAxis.setPrivate("max", max); // needed in order not to animate

      // recalculate start and end so that the selection would remain
      dateAxis.set("start", start / end);
      dateAxis.set("end", 1);
    }
  });
}


function loadSomeData() {
  var start = dateAxis.get("start");
  var end = dateAxis.get("end");

  var selectionMin = Math.max(dateAxis.getPrivate("selectionMin"), absoluteMin);
  var selectionMax = Math.min(dateAxis.getPrivate("selectionMax"), absoluteMax);

  var min = dateAxis.getPrivate("min");
  var max = dateAxis.getPrivate("max");

  // if start is less than 0, means we are panning to the right, need to load data to the left (earlier days)
  if (start < 0) {
    loadData(currentUnit, selectionMin, min, "left");
  }
  // if end is bigger than 1, means we are panning to the left, need to load data to the right (later days)
  if (end > 1) {
    loadData(currentUnit, max, selectionMax, "right");
  }
}

// Button handlers
var activeButton = document.getElementById("btn_d");
document.getElementById("btn_h").addEventListener("click", function () {
  if (currentUnit != "hour") {
    setActiveButton(this);
    currentUnit = "hour";
    loadData("hour", dateAxis.getPrivate("selectionMin"), dateAxis.getPrivate("selectionMax"), "none");
  }
})

document.getElementById("btn_d").addEventListener("click", function () {
  if (currentUnit != "day") {
    setActiveButton(this);
    currentUnit = "day";
    loadData("day", dateAxis.getPrivate("selectionMin"), dateAxis.getPrivate("selectionMax"), "none");
  }
})

document.getElementById("btn_m").addEventListener("click", function () {
  if (currentUnit != "month") {
    setActiveButton(this);
    currentUnit = "month";
    loadData("month", dateAxis.getPrivate("selectionMin"), dateAxis.getPrivate("selectionMax"), "none");
  }
})

function setActiveButton(button) {
  if (activeButton) {
    activeButton.className = "";
  }
  activeButton = button;
  button.className = "active";
}

var currentDate = new Date();
var currentUnit = "day";

// initially load 50 days
var min = currentDate.getTime() - am5.time.getDuration("day", 50);
var max = currentDate.getTime();

// limit to the data's extremes
var absoluteMax = max;
var absoluteMin = new Date(2000, 0, 1, 0, 0, 0, 0);

// load data when panning ends
chart.events.on("panended", function () {
  loadSomeData();
});


var wheelTimeout;
chart.events.on("wheelended", function () {
  // load data with some delay when wheel ends, as this is event is fired a lot
  // if we already set timeout for loading, dispose it
  if (wheelTimeout) {
    wheelTimeout.dispose();
  }

  wheelTimeout = chart.setTimeout(function () {
    loadSomeData();
  }, 50);
});

// load some initial data
loadData("day", min, max, "none");

// Make stuff animate on load
// https://www.amcharts.com/docs/v5/concepts/animations/
chart.appear(1000, 500);

}); // end am5.ready()
</script>

<!-- HTML -->
<div id="chartdiv"></div>
<div id="tools">
  Select data granularity
  <input type="button" value="1 hour" id="btn_h">
  <input type="button" value="1 day" id="btn_d" class="active">
  <input type="button" value="1 month" id="btn_m">
</div>