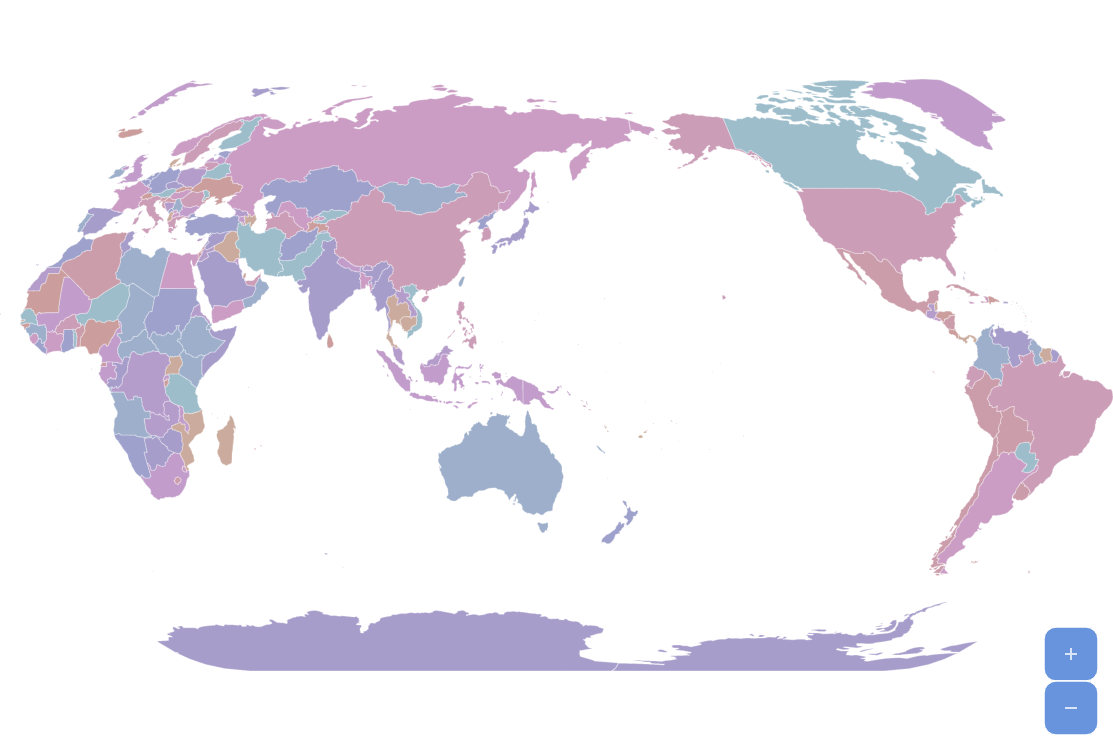
Pacific-Centered Map
World map in amCharts 5 can be Pacific-centered, this is useful for Asian countries which often use this kind of map. Actually you can center the map at any longitude – drag the map to change its center.
Key implementation details
Setting rotationX property on a Map Chart “moves” the center to the required position (-154.8 in this case for a Pacific-centered map).
Related tutorials
Demo source
<!-- Styles -->
<style>
#chartdiv {
  width: 100%;
  height: 500px;
}
</style>

<!-- Resources -->
<script src="https://cdn.amcharts.com/lib/5/index.js"></script>
<script src="https://cdn.amcharts.com/lib/5/map.js"></script>
<script src="https://cdn.amcharts.com/lib/5/geodata/worldLow.js"></script>
<script src="https://cdn.amcharts.com/lib/5/themes/Animated.js"></script>

<!-- Chart code -->
<script>
am5.ready(function() {

// Create root element
// https://www.amcharts.com/docs/v5/getting-started/#Root_element
var root = am5.Root.new("chartdiv");


// Set themes
// https://www.amcharts.com/docs/v5/concepts/themes/
root.setThemes([
  am5themes_Animated.new(root)
]);


// Create the map chart
// https://www.amcharts.com/docs/v5/charts/map-chart/
// setting rotationX to -154.8 makes the map Pacific-centered
var chart = root.container.children.push(am5map.MapChart.new(root, {
  panX: "rotateX",
  panY: "none",
  projection: am5map.geoNaturalEarth1(),
  rotationX: -154.8
}));


// Create main polygon series for countries
// https://www.amcharts.com/docs/v5/charts/map-chart/map-polygon-series/
var polygonSeries = chart.series.push(am5map.MapPolygonSeries.new(root, {
  geoJSON: am5geodata_worldLow
}));

polygonSeries.mapPolygons.template.setAll({
  tooltipText: "{name}",
  fillOpacity: 0.8
});

var colorSet = am5.ColorSet.new(root, {});

var i = 0;
polygonSeries.mapPolygons.template.adapters.add("fill", function (fill, target) {
  if (i < 10) {
    i++;
  }
  else {
    i = 0;
  }
  var dataContext = target.dataItem.dataContext;
  if (!dataContext.colorWasSet) {
    dataContext.colorWasSet = true;
    var color = am5.Color.saturate(colorSet.getIndex(i), 0.3);
    target.setRaw("fill", color);
    return color;
  }
  else {
    return fill;
  }
})

polygonSeries.mapPolygons.template.states.create("hover", { fillOpacity: 1 });

var graticuleSeries = chart.series.push(am5map.GraticuleSeries.new(root, {}));
graticuleSeries.mapLines.template.setAll({
  stroke: root.interfaceColors.get("alternativeBackground"),
  strokeOpacity: 0.1
});

// Add zoom control
// https://www.amcharts.com/docs/v5/charts/map-chart/map-pan-zoom/#Zoom_control
var zoomControl = chart.set("zoomControl", am5map.ZoomControl.new(root, {}));
zoomControl.homeButton.set("visible", true);

// Set clicking on "water" to zoom out
chart.chartContainer.get("background").events.on("click", function() {
  chart.goHome();
})


// Make stuff animate on load
chart.appear(1000, 100);

}); // end am5.ready()
</script>

<!-- HTML -->
<div id="chartdiv"></div>