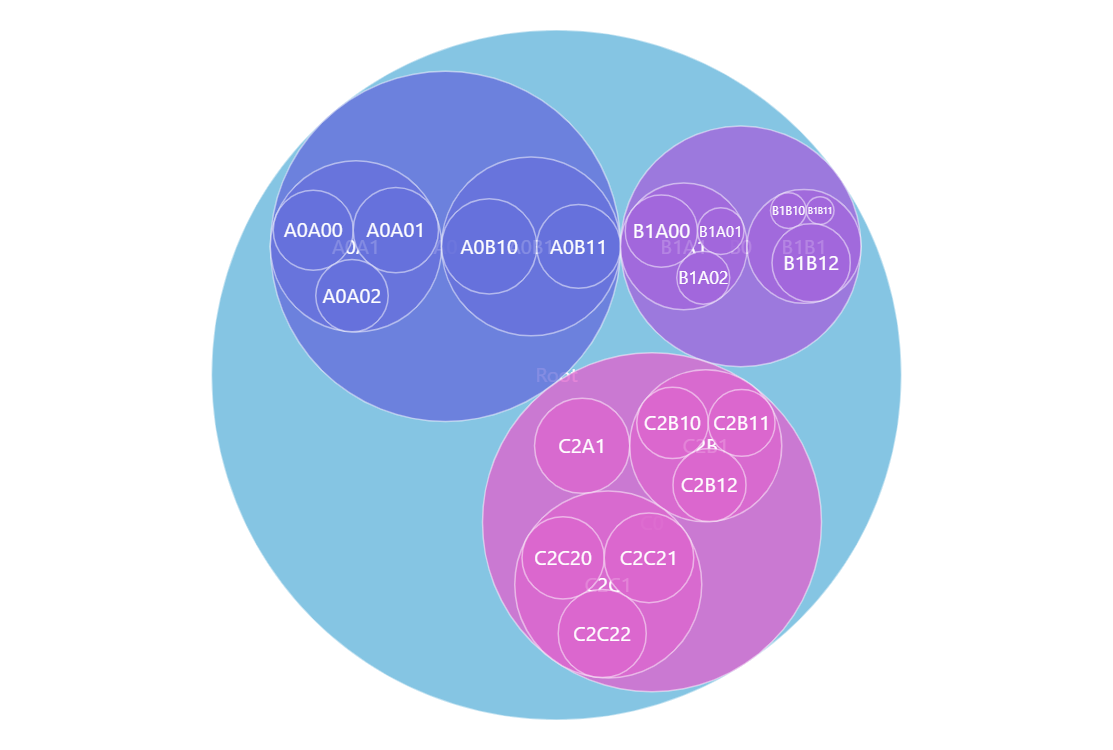
Packed Circle Chart
Packed Circle Chart is great for visualizing hierarchical data. Circles on the bottom (leaf) level represent the values on that level and then they are packed (hence the name) into parent circles and determine their size. This way you can see a birds-eye view of the values in your data and also drill down for the details. Try clicking on the circles in the demo.
Key implementation details
Packed Circle Chart along with other hierarchical charts is covered by the hierarchy module of amCharts Charts. To add a Packed Circle chart we just create a Container and add a Pack child into it. Then we just need to add hierarchical data and configure the appropriate value fields.
Related tutorials
Demo source
<!-- Styles -->
<style>
#chartdiv {
  width: 100%;
  height: 550px;
}
</style>

<!-- Resources -->
<script src="https://cdn.amcharts.com/lib/5/index.js"></script>
<script src="https://cdn.amcharts.com/lib/5/hierarchy.js"></script>
<script src="https://cdn.amcharts.com/lib/5/themes/Animated.js"></script>

<!-- Chart code -->
<script>
am5.ready(function() {

// Create root element
// https://www.amcharts.com/docs/v5/getting-started/#Root_element
var root = am5.Root.new("chartdiv");


// Set themes
// https://www.amcharts.com/docs/v5/concepts/themes/
root.setThemes([
  am5themes_Animated.new(root)
]);


// Create wrapper container
var container = root.container.children.push(am5.Container.new(root, {
  width: am5.percent(100),
  height: am5.percent(100),
  layout: root.verticalLayout
}));


// Create series
// https://www.amcharts.com/docs/v5/charts/hierarchy/#Adding
var series = container.children.push(am5hierarchy.Pack.new(root, {
  singleBranchOnly: false,
  downDepth: 1,
  initialDepth: 10,
  valueField: "value",
  categoryField: "name",
  childDataField: "children"
}));


// Generate and set data
// https://www.amcharts.com/docs/v5/charts/hierarchy/#Setting_data
var maxLevels = 2;
var maxNodes = 3;
var maxValue = 100;

var data = {
  name: "Root",
  children: []
}
generateLevel(data, "", 0);

series.data.setAll([data]);
series.set("selectedDataItem", series.dataItems[0]);

function generateLevel(data, name, level) {
  for (var i = 0; i < Math.ceil(maxNodes * Math.random()) + 1; i++) {
    var nodeName = name + "ABCDEFGHIJKLMNOPQRSTUVWXYZ"[i];
    var child;
    if (level < maxLevels) {
      child = {
        name: nodeName + level
      }

      if (level > 0 && Math.random() < 0.5) {
        child.value = Math.round(Math.random() * maxValue);
      }
      else {
        child.children = [];
        generateLevel(child, nodeName + i, level + 1)
      }
    }
    else {
      child = {
        name: name + i,
        value: Math.round(Math.random() * maxValue)
      }
    }
    data.children.push(child);
  }

  level++;
  return data;
}


// Make stuff animate on load
series.appear(1000, 100);

}); // end am5.ready()
</script>

<!-- HTML -->
<div id="chartdiv"></div>