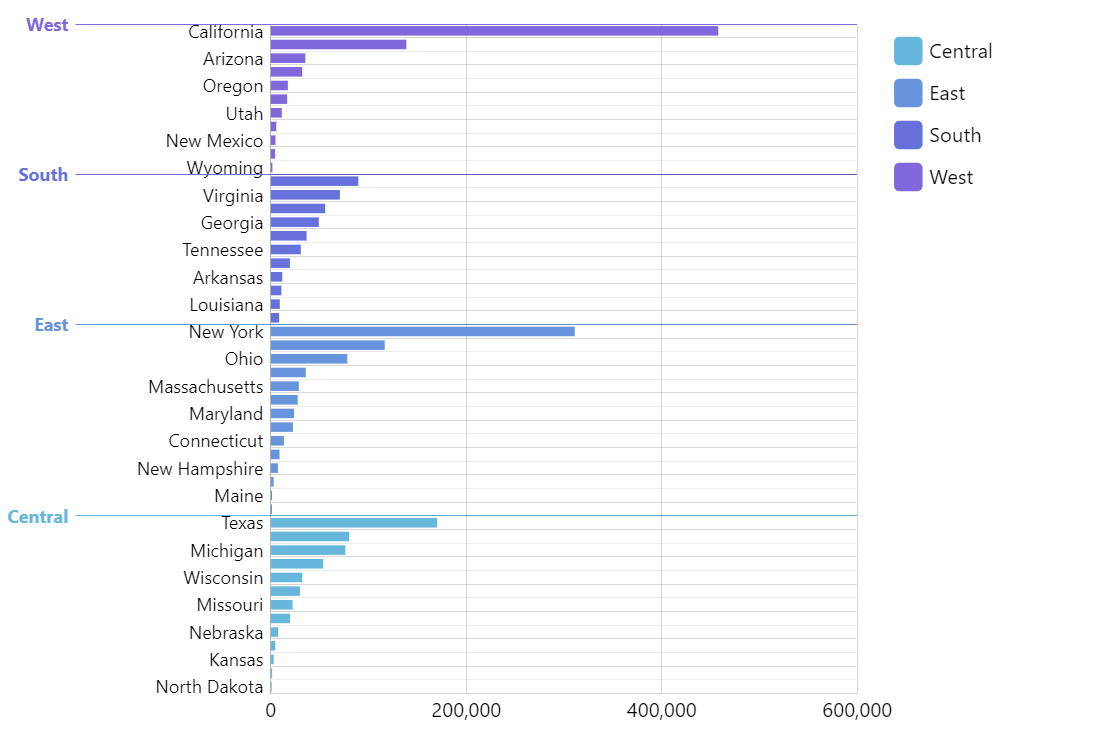
Partitioned Bar Chart
Sometimes you need to group and partition parts of your bar chart. amCharts XY Chart has all the tools for you to address that need.
Key implementation details
We use a feature called axis ranges to create these partitions next to “boundary” items by setting range’s category field to the state’s name next to which the range should be created.
Related tutorials
Demo source
<!-- Styles -->
<style>
#chartdiv {
  width: 100%;
  height: 800px;
}
</style>

<!-- Resources -->
<script src="https://cdn.amcharts.com/lib/5/index.js"></script>
<script src="https://cdn.amcharts.com/lib/5/xy.js"></script>
<script src="https://cdn.amcharts.com/lib/5/themes/Animated.js"></script>

<!-- Chart code -->
<script>
am5.ready(function() {

// Create root element
// https://www.amcharts.com/docs/v5/getting-started/#Root_element
var root = am5.Root.new("chartdiv");


// Set themes
// https://www.amcharts.com/docs/v5/concepts/themes/
root.setThemes([
  am5themes_Animated.new(root)
]);


// Create chart
// https://www.amcharts.com/docs/v5/charts/xy-chart/
var chart = root.container.children.push(am5xy.XYChart.new(root, {
  panX: false,
  panY: false,
  wheelX: "none",
  wheelY: "none",
  layout: root.horizontalLayout,
  paddingLeft: 0
}));


// Add legend
// https://www.amcharts.com/docs/v5/charts/xy-chart/legend-xy-series/
var legendData = [];
var legend = chart.children.push(
  am5.Legend.new(root, {
    nameField: "name",
    fillField: "color",
    strokeField: "color",
    //centerY: am5.p50,
    marginLeft: 20,
    y: 20,
    layout: root.verticalLayout,
    clickTarget: "none"
  })
);

var data = [{
  region: "Central",
  state: "North Dakota",
  sales: 920
}, {
  region: "Central",
  state: "South Dakota",
  sales: 1317
}, {
  region: "Central",
  state: "Kansas",
  sales: 2916
}, {
  region: "Central",
  state: "Iowa",
  sales: 4577
}, {
  region: "Central",
  state: "Nebraska",
  sales: 7464
}, {
  region: "Central",
  state: "Oklahoma",
  sales: 19686
}, {
  region: "Central",
  state: "Missouri",
  sales: 22207
}, {
  region: "Central",
  state: "Minnesota",
  sales: 29865
}, {
  region: "Central",
  state: "Wisconsin",
  sales: 32125
}, {
  region: "Central",
  state: "Indiana",
  sales: 53549
}, {
  region: "Central",
  state: "Michigan",
  sales: 76281
}, {
  region: "Central",
  state: "Illinois",
  sales: 80162
}, {
  region: "Central",
  state: "Texas",
  sales: 170187
}, {
  region: "East",
  state: "West Virginia",
  sales: 1209
}, {
  region: "East",
  state: "Maine",
  sales: 1270
}, {
  region: "East",
  state: "District of Columbia",
  sales: 2866
}, {
  region: "East",
  state: "New Hampshire",
  sales: 7294
}, {
  region: "East",
  state: "Vermont",
  sales: 8929
}, {
  region: "East",
  state: "Connecticut",
  sales: 13386
}, {
  region: "East",
  state: "Rhode Island",
  sales: 22629
}, {
  region: "East",
  state: "Maryland",
  sales: 23707
}, {
  region: "East",
  state: "Delaware",
  sales: 27453
}, {
  region: "East",
  state: "Massachusetts",
  sales: 28639
}, {
  region: "East",
  state: "New Jersey",
  sales: 35763
}, {
  region: "East",
  state: "Ohio",
  sales: 78253
}, {
  region: "East",
  state: "Pennsylvania",
  sales: 116522
}, {
  region: "East",
  state: "New York",
  sales: 310914
}, {
  region: "South",
  state: "South Carolina",
  sales: 8483
}, {
  region: "South",
  state: "Louisiana",
  sales: 9219
}, {
  region: "South",
  state: "Mississippi",
  sales: 10772
}, {
  region: "South",
  state: "Arkansas",
  sales: 11678
}, {
  region: "South",
  state: "Alabama",
  sales: 19511
}, {
  region: "South",
  state: "Tennessee",
  sales: 30662
}, {
  region: "South",
  state: "Kentucky",
  sales: 36598
}, {
  region: "South",
  state: "Georgia",
  sales: 49103
}, {
  region: "South",
  state: "North Carolina",
  sales: 55604
}, {
  region: "South",
  state: "Virginia",
  sales: 70641
}, {
  region: "South",
  state: "Florida",
  sales: 89479
}, {
  region: "West",
  state: "Wyoming",
  sales: 1603
}, {
  region: "West",
  state: "Idaho",
  sales: 4380
}, {
  region: "West",
  state: "New Mexico",
  sales: 4779
}, {
  region: "West",
  state: "Montana",
  sales: 5589
}, {
  region: "West",
  state: "Utah",
  sales: 11223
}, {
  region: "West",
  state: "Nevada",
  sales: 16729
}, {
  region: "West",
  state: "Oregon",
  sales: 17431
}, {
  region: "West",
  state: "Colorado",
  sales: 32110
}, {
  region: "West",
  state: "Arizona",
  sales: 35283
}, {
  region: "West",
  state: "Washington",
  sales: 138656
}, {
  region: "West",
  state: "California",
  sales: 457731
}];


// Create axes
// https://www.amcharts.com/docs/v5/charts/xy-chart/axes/
var yAxis = chart.yAxes.push(am5xy.CategoryAxis.new(root, {
  categoryField: "state",
  renderer: am5xy.AxisRendererY.new(root, {
    minGridDistance: 10,
    minorGridEnabled: true
  }),
  tooltip: am5.Tooltip.new(root, {})
}));

yAxis.get("renderer").labels.template.setAll({
  fontSize: 12,
  location: 0.5
})

yAxis.data.setAll(data);

var xAxis = chart.xAxes.push(am5xy.ValueAxis.new(root, {
  renderer: am5xy.AxisRendererX.new(root, {}),
  tooltip: am5.Tooltip.new(root, {})
}));


// Add series
// https://www.amcharts.com/docs/v5/charts/xy-chart/series/
var series = chart.series.push(am5xy.ColumnSeries.new(root, {
  xAxis: xAxis,
  yAxis: yAxis,
  valueXField: "sales",
  categoryYField: "state",
  tooltip: am5.Tooltip.new(root, {
    pointerOrientation: "horizontal"
  })
}));

series.columns.template.setAll({
  tooltipText: "{categoryY}: [bold]{valueX}[/]",
  width: am5.percent(90),
  strokeOpacity: 0
});

series.columns.template.adapters.add("fill", function(fill, target) {
  if (target.dataItem) {
    switch(target.dataItem.dataContext.region) {
      case "Central":
        return chart.get("colors").getIndex(0);
        break;
      case "East":
        return chart.get("colors").getIndex(1);
        break;
      case "South":
        return chart.get("colors").getIndex(2);
        break;
      case "West":
        return chart.get("colors").getIndex(3);
        break;
    }
  }
  return fill;
})

series.data.setAll(data);

function createRange(label, category, color) {
  var rangeDataItem = yAxis.makeDataItem({
    category: category
  });

  var range = yAxis.createAxisRange(rangeDataItem);

  rangeDataItem.get("label").setAll({
    fill: color,
    text: label,
    location: 1,
    fontWeight: "bold",
    dx: -130
  });

  rangeDataItem.get("grid").setAll({
    stroke: color,
    strokeOpacity: 1,
    location: 1
  });

  rangeDataItem.get("tick").setAll({
    stroke: color,
    strokeOpacity: 1,
    location: 1,
    visible: true,
    length: 130
  });

  legendData.push({ name: label, color: color });

}

createRange("Central", "Texas", chart.get("colors").getIndex(0));
createRange("East", "New York", chart.get("colors").getIndex(1));
createRange("South", "Florida", chart.get("colors").getIndex(2));
createRange("West", "California", chart.get("colors").getIndex(3));

legend.data.setAll(legendData);

// Add cursor
// https://www.amcharts.com/docs/v5/charts/xy-chart/cursor/
var cursor = chart.set("cursor", am5xy.XYCursor.new(root, {
  xAxis: xAxis,
  yAxis: yAxis
}));


// Make stuff animate on load
// https://www.amcharts.com/docs/v5/concepts/animations/
series.appear();
chart.appear(1000, 100);

}); // end am5.ready()
</script>

<!-- HTML -->
<div id="chartdiv"></div>