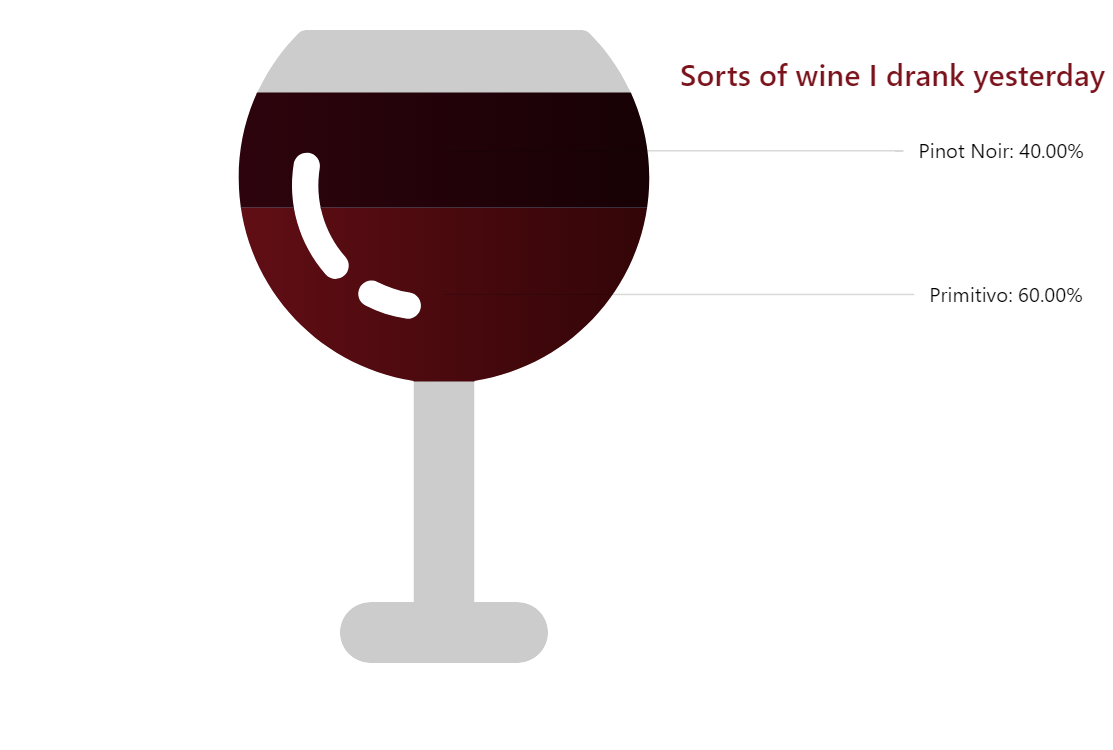
Pictorial Chart
Sometimes you might want the picture you want to use for pictorial chart not to be filled completely from bottom to the top, like this one. Our PictorialStackedSeries has startLocation and endLocation properties which help to adjust start/end locations of the fills. Try to drag the slider to do it yourself.
Related tutorials
Demo source
<!-- Styles -->
<style>
#chartdiv {
  width: 100%;
  height: 600px;
}
</style>

<!-- Resources -->
<script src="https://cdn.amcharts.com/lib/5/index.js"></script>
<script src="https://cdn.amcharts.com/lib/5/percent.js"></script>
<script src="https://cdn.amcharts.com/lib/5/themes/Animated.js"></script>

<!-- Chart code -->
<script>
am5.ready(function() {

// Create root element
// https://www.amcharts.com/docs/v5/getting-started/#Root_element
var root = am5.Root.new("chartdiv");


// Set themes
// https://www.amcharts.com/docs/v5/concepts/themes/
root.setThemes([
  am5themes_Animated.new(root)
]);


// Create chart
// https://www.amcharts.com/docs/v5/charts/percent-charts/sliced-chart/
var chart = root.container.children.push(am5percent.SlicedChart.new(root, {
  paddingTop: 20,
  paddingBottom: 20,
  layout: root.verticalLayout
}));

var svgPath = "M256.814,72.75c0-26.898-10.451-52.213-29.43-71.277C226.444,0.529,225.17,0,223.84,0H87.712c-1.329,0-2.604,0.529-3.543,1.473c-18.978,19.064-29.43,44.379-29.43,71.277c0,50.615,37.414,92.654,86.037,99.922v108.88h-21.25c-8.271,0-15,6.729-15,15c0,8.271,6.729,15,15,15h72.5c8.271,0,15-6.729,15-15c0-8.271-6.729-15-15-15h-21.25v-108.88C219.399,165.404,256.814,123.365,256.814,72.75z M106.709,120.879c-1.234,1.083-2.765,1.615-4.285,1.615c-1.807,0-3.604-0.748-4.888-2.212c-13.153-14.986-18.888-34.832-15.733-54.451c0.571-3.543,3.902-5.956,7.45-5.385c3.544,0.57,5.955,3.905,5.386,7.45c-2.538,15.779,2.079,31.747,12.667,43.811C109.674,114.404,109.406,118.511,106.709,120.879z M144.351,136.662c-0.514,3.194-3.274,5.468-6.409,5.468c-0.343,0-0.69-0.027-1.041-0.083c-6.937-1.117-13.6-3.299-19.804-6.488c-3.193-1.641-4.451-5.559-2.811-8.752c1.641-3.194,5.563-4.451,8.752-2.81c4.985,2.562,10.345,4.317,15.929,5.215C142.511,129.782,144.922,133.118,144.351,136.662z";

// Create series
// https://www.amcharts.com/docs/v5/charts/percent-charts/sliced-chart/#Series
var series = chart.series.push(am5percent.PictorialStackedSeries.new(root, {
  alignLabels: true,
  orientation: "vertical",
  valueField: "value",
  categoryField: "name",
  startLocation: 0.1,
  endLocation: 0.554,
  svgPath: svgPath
}));

series.slices.template.setAll({
  templateField: "sliceSettings",
  fillGradient: am5.LinearGradient.new(root, {
    rotation:0,
    stops: [{ brighten: 0 }, { brighten: -0.8 }]
  }),
  strokeGradient: am5.LinearGradient.new(root, {
    rotation:0,
    stops: [{ brighten: 0 }, { brighten: -0.8 }]
  })
});
series.labelsContainer.set("width", 150);

var slider = chart.children.push(
  am5.Slider.new(root, {
    orientation: "horizontal",
    start: 0,
    width: am5.percent(60),
    centerY: am5.p50,
    centerX: am5.p50,
    x: am5.p50,
    exportable: false
  })
);

var label = chart.children.push(am5.Label.new(root, {
  x: am5.p100,
  centerX: am5.p100,
  paddingRight: 10,
  fontSize: "1.5em",
  fontWeight: "500",
  y: 30,
  position: "absolute",
  text: "Sorts of wine I drank yesterday",
  fill: am5.color(0x7b131c)
}))

slider.events.on("rangechanged", function() {
  var sliderPosition = slider.get("start");
  series.dataItems[0].set("valueWorking", series.dataItems[0].get("value") * (1 - sliderPosition));
  series.set("startLocation", 0.1 + (0.554 - 0.1) * sliderPosition);
  slider.get("background").set("fill", am5.Color.interpolate(sliderPosition, am5.color(0xdadada), am5.color(0x390511)))
})


// Set data
// https://www.amcharts.com/docs/v5/charts/percent-charts/sliced-chart/#Setting_data
series.data.setAll([{
  name: "Pinot Noir",
  value: 200,
  sliceSettings: {
    fill: am5.color(0x390511),
    stroke: am5.color(0x390511)
  }
},
{
  name: "Primitivo",
  value: 300,
  sliceSettings: {
    fill: am5.color(0x7b131c),
    stroke: am5.color(0x7b131c)
  }
}]);


// Play initial series animation
// https://www.amcharts.com/docs/v5/concepts/animations/#Animation_of_series
chart.appear(1000, 100);

}); // end am5.ready()
</script>

<!-- HTML -->
<div id="chartdiv"></div>