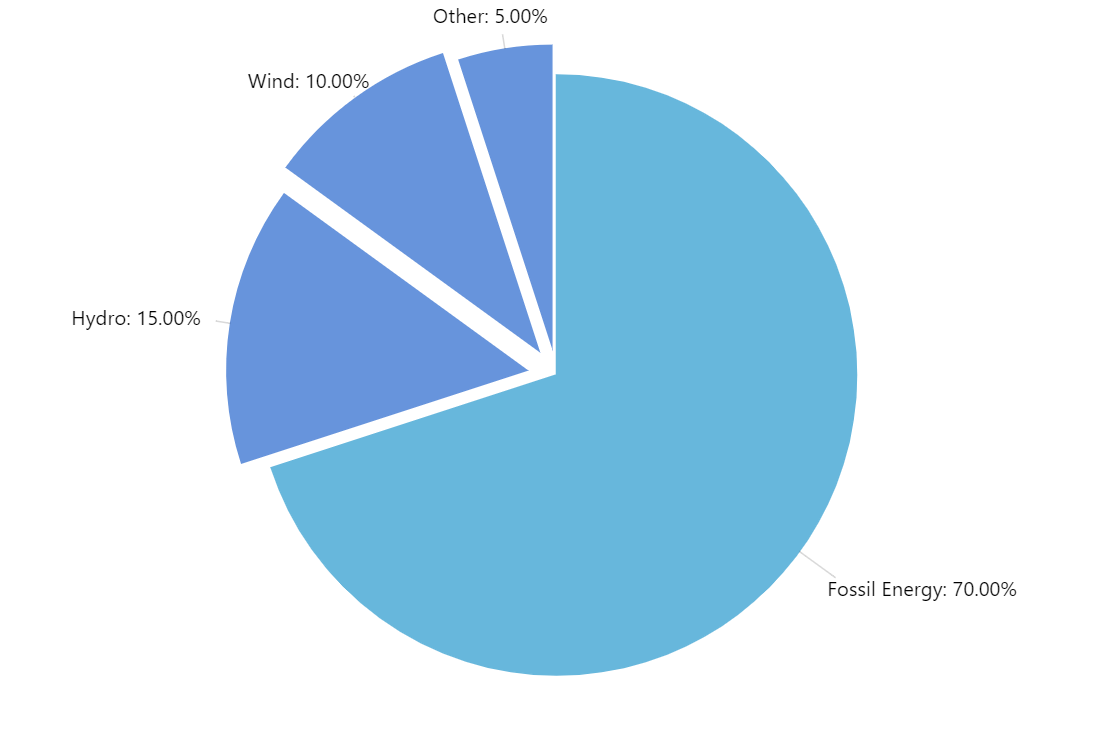
Pie Chart with Broken Down Slices
Drilling down from a high-level overview to more details is one of the main advantages of interactive data visualizations. This demo shows you one such scenario utilizing a pie chart. Click on one of the slices to see it in action.
Key implementation details
The trick here is that we just change the underlying data of the series when the user clicks on a slice. For the selected slice we replace it with data for sub-slices.
Related tutorials
Demo source
<!-- Styles -->
<style>
#chartdiv {
  width: 100%;
  height: 500px;
}
</style>

<!-- Resources -->
<script src="https://cdn.amcharts.com/lib/5/index.js"></script>
<script src="https://cdn.amcharts.com/lib/5/percent.js"></script>
<script src="https://cdn.amcharts.com/lib/5/themes/Animated.js"></script>

<!-- Chart code -->
<script>
am5.ready(function() {

// Create root and chart
var root = am5.Root.new("chartdiv");

root.setThemes([
  am5themes_Animated.new(root)
]);

var chart = root.container.children.push(
  am5percent.PieChart.new(root, {
    layout: root.verticalLayout
  })
);

// Create series
var series = chart.series.push(
  am5percent.PieSeries.new(root, {
    valueField: "percent",
    categoryField: "type",
    fillField: "color",
    alignLabels: false
  })
);

series.slices.template.set("templateField", "sliceSettings");
series.labels.template.set("radius", 30);

// Set up click events
series.slices.template.events.on("click", function(event) {
  console.log(event.target.dataItem.dataContext)
  if (event.target.dataItem.dataContext.id != undefined) {
    selected = event.target.dataItem.dataContext.id;
  } else {
    selected = undefined;
  }
  series.data.setAll(generateChartData());
});

// Define data
var selected;
var types = [{
  type: "Fossil Energy",
  percent: 70,
  color: series.get("colors").getIndex(0),
  subs: [{
    type: "Oil",
    percent: 15
  }, {
    type: "Coal",
    percent: 35
  }, {
    type: "Nuclear",
    percent: 20
  }]
}, {
  type: "Green Energy",
  percent: 30,
  color: series.get("colors").getIndex(1),
  subs: [{
    type: "Hydro",
    percent: 15
  }, {
    type: "Wind",
    percent: 10
  }, {
    type: "Other",
    percent: 5
  }]
}];
series.data.setAll(generateChartData());


function generateChartData() {
  var chartData = [];
  for (var i = 0; i < types.length; i++) {
    if (i == selected) {
      for (var x = 0; x < types[i].subs.length; x++) {
        chartData.push({
          type: types[i].subs[x].type,
          percent: types[i].subs[x].percent,
          color: types[i].color,
          pulled: true,
          sliceSettings: {
            active: true
          }
        });
      }
    } else {
      chartData.push({
        type: types[i].type,
        percent: types[i].percent,
        color: types[i].color,
        id: i
      });
    }
  }
  return chartData;
}

}); // end am5.ready()
</script>

<!-- HTML -->
<div id="chartdiv"></div>