Polar Chart
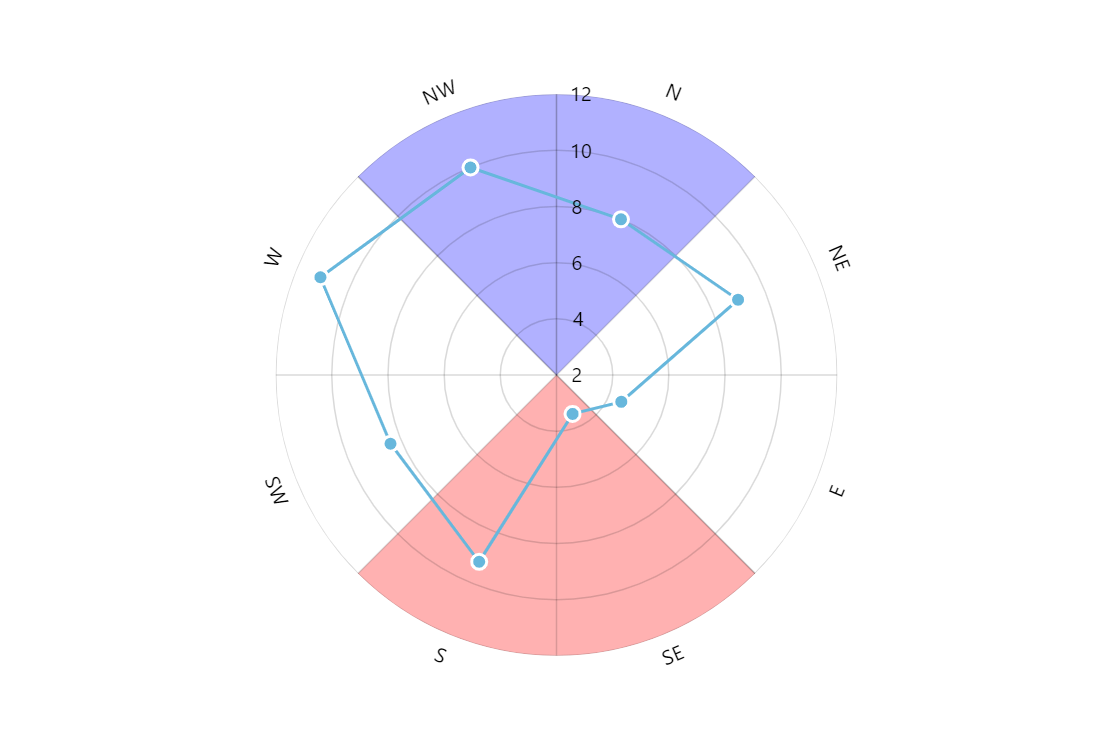
Polar Chart is a variation of Radar Chart where points are placed in the polar coordinate system and values represent the distance from the pole (center).
Key implementation details
In terms of implementation, there’s nothing specifically different from creating a Radar Chart. What makes it a Polar Chart is that we use polar coordinate system (directions) as categories for our circular X axis.
Related tutorials
Demo source
<!-- Styles -->
<style>
#chartdiv {
  width: 100%;
  height: 500px;
}
</style>

<!-- Resources -->
<script src="https://cdn.amcharts.com/lib/5/index.js"></script>
<script src="https://cdn.amcharts.com/lib/5/xy.js"></script>
<script src="https://cdn.amcharts.com/lib/5/radar.js"></script>
<script src="https://cdn.amcharts.com/lib/5/themes/Animated.js"></script>

<!-- Chart code -->
<script>
am5.ready(function() {

// Create root element
// https://www.amcharts.com/docs/v5/getting-started/#Root_element
var root = am5.Root.new("chartdiv");

// Set themes
// https://www.amcharts.com/docs/v5/concepts/themes/
root.setThemes([
  am5themes_Animated.new(root)
]);

// Generate and set data
// https://www.amcharts.com/docs/v5/charts/radar-chart/#Setting_data
var cat = -1;
var value = 10;

function generateData() {
  value = Math.round(Math.random() * 10);
  cat++;
  return {
    category: "cat" + cat,
    value: value
  };
}

function generateDatas(count) {
  cat = -1;
  var data = [];
  for (var i = 0; i < count; ++i) {
    data.push(generateData());
  }
  return data;
}

// Create chart
// https://www.amcharts.com/docs/v5/charts/radar-chart/
var chart = root.container.children.push(am5radar.RadarChart.new(root, {
  panX: false,
  panY: false,
  wheelX: "panX",
  wheelY: "zoomX"
}));

// Add cursor
// https://www.amcharts.com/docs/v5/charts/radar-chart/#Cursor
var cursor = chart.set("cursor", am5radar.RadarCursor.new(root, {
  behavior: "none"
}));

cursor.lineY.set("visible", false);
cursor.lineX.set("visible", false);

// Create axes and their renderers
// https://www.amcharts.com/docs/v5/charts/radar-chart/#Adding_axes
var xRenderer = am5radar.AxisRendererCircular.new(root, {});
xRenderer.labels.template.setAll({
  radius: 10
});

var xAxis = chart.xAxes.push(am5xy.CategoryAxis.new(root, {
  maxDeviation: 0,
  categoryField: "direction",
  renderer: xRenderer
}));

var yAxis = chart.yAxes.push(am5xy.ValueAxis.new(root, {
  renderer: am5radar.AxisRendererRadial.new(root, {})
}));

// Create series
// https://www.amcharts.com/docs/v5/charts/radar-chart/#Adding_series

var series = chart.series.push(am5radar.RadarLineSeries.new(root, {
  stacked: true,
  name: "Series ",
  xAxis: xAxis,
  yAxis: yAxis,
  valueYField: "value",
  categoryXField: "direction",
  tooltip: am5.Tooltip.new(root, {
    labelText: "{categoryX}: {valueY}"
  })
}));


series.strokes.template.set("strokeWidth", 2);
series.bullets.push(function() {
  return am5.Bullet.new(root, {
    sprite: am5.Circle.new(root, {
      radius: 5,
      fill: series.get("fill"),
      strokeWidth: 2,
      stroke: root.interfaceColors.get("background")
    })
  })
})

var data = [{
  "direction": "N",
  "value": 8
}, {
  "direction": "NE",
  "value": 9
}, {
  "direction": "E",
  "value": 4.5
}, {
  "direction": "SE",
  "value": 3.5
}, {
  "direction": "S",
  "value": 9.2
}, {
  "direction": "SW",
  "value": 8.4
}, {
  "direction": "W",
  "value": 11.1
}, {
  "direction": "NW",
  "value": 10
}]

series.data.setAll(data);
xAxis.data.setAll(data);

var range0 = xAxis.createAxisRange(xAxis.makeDataItem({ category: "NW", endCategory: "NW" }));
range0.get("axisFill").setAll({
  visible: true,
  fill: am5.color(0x0000ff),
  fillOpacity: 0.3
})

var range1 = xAxis.createAxisRange(xAxis.makeDataItem({ category: "N", endCategory: "N" }));
range1.get("axisFill").setAll({
  visible: true,
  fill: am5.color(0x0000ff),
  fillOpacity: 0.3
})

var range2 = xAxis.createAxisRange(xAxis.makeDataItem({ category: "SE", endCategory: "S" }));
range2.get("axisFill").setAll({
  visible: true,
  fill: am5.color(0xFF0000),
  fillOpacity: 0.3
})

chart.radarContainer.children.moveValue(chart.topGridContainer, 0);

// Animate chart
// https://www.amcharts.com/docs/v5/concepts/animations/#Initial_animation
series.appear(1000);
chart.appear(1000, 100);

}); // end am5.ready()
</script>

<!-- HTML -->
<div id="chartdiv"></div>