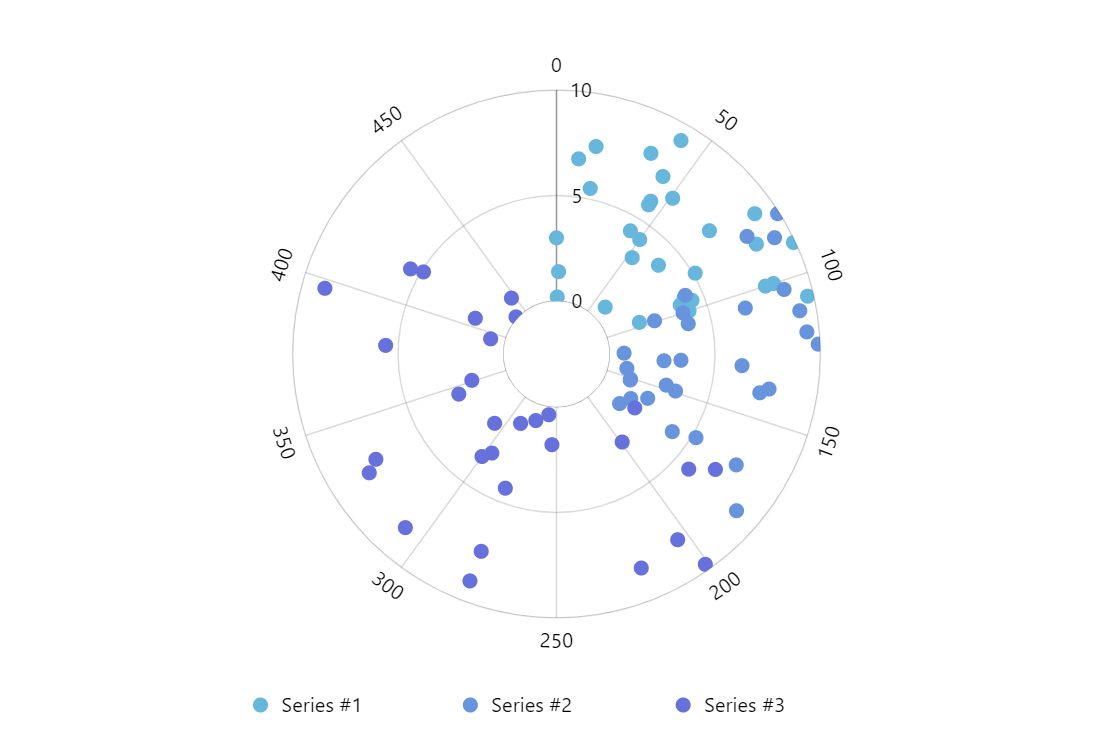
Polar Scatter
Polar scatter plots are great for visualizing discreet data that has periodic nature.
Key implementation details
The points in this demo are in fact bullets on a line series (RadarLineSeries). We just set forceHidden: true on the series strokes template to remove the lines and just keep the bullets.
Related tutorials
Demo source
<!-- Styles -->
<style>
#chartdiv {
  width: 100%;
  height: 500px;
}
</style>

<!-- Resources -->
<script src="https://cdn.amcharts.com/lib/5/index.js"></script>
<script src="https://cdn.amcharts.com/lib/5/xy.js"></script>
<script src="https://cdn.amcharts.com/lib/5/radar.js"></script>
<script src="https://cdn.amcharts.com/lib/5/themes/Animated.js"></script>

<!-- Chart code -->
<script>
am5.ready(function() {

// Create root element
// https://www.amcharts.com/docs/v5/getting-started/#Root_element
var root = am5.Root.new("chartdiv");


// Set themes
// https://www.amcharts.com/docs/v5/concepts/themes/
root.setThemes([
  am5themes_Animated.new(root)
]);


// Create chart
// https://www.amcharts.com/docs/v5/charts/radar-chart/
var chart = root.container.children.push(am5radar.RadarChart.new(root, {
  panX: false,
  panY: false,
  wheelX: "panX",
  wheelY: "zoomX",
  innerRadius: am5.percent(20),
  layout: root.verticalLayout
}));


// Add cursor
// https://www.amcharts.com/docs/v5/charts/radar-chart/#Cursor
var cursor = chart.set("cursor", am5radar.RadarCursor.new(root, {
  behavior: "zoomX"
}));

cursor.lineY.set("visible", false);


// Create axes and their renderers
// https://www.amcharts.com/docs/v5/charts/radar-chart/#Adding_axes
var xRenderer = am5radar.AxisRendererCircular.new(root, {
  strokeOpacity: 0.1
});

xRenderer.labels.template.setAll({
  radius: 10,
  maxPosition: 0.98
});

var xAxis = chart.xAxes.push(am5xy.ValueAxis.new(root, {
  renderer: xRenderer,
  extraMax: 0.1,
  tooltip: am5.Tooltip.new(root, {})
}));

var yAxis = chart.yAxes.push(am5xy.ValueAxis.new(root, {
  renderer: am5radar.AxisRendererRadial.new(root, {})
}));


// Create series
// https://www.amcharts.com/docs/v5/charts/radar-chart/#Adding_series
function createSeries(name, data) {
  var series = chart.series.push(am5radar.RadarLineSeries.new(root, {
    name: name,
    xAxis: xAxis,
    yAxis: yAxis,
    valueXField: "x",
    valueYField: "y",
    sequencedInterpolation: true
  }));

  series.set("stroke", root.interfaceColors.get("background"));
  series.strokes.template.setAll({
    forceHidden: true
  });

  series.bullets.push(function() {
    return am5.Bullet.new(root, {
      sprite: am5.Circle.new(root, {
        radius: 5,
        fill: series.get("fill")
      })
    });
  });

  series.data.setAll(data);
  series.appear(1000);
}

createSeries("Series #1", [
  { "x": 83, "y": 5.1 },
  { "x": 44, "y": 5.8 },
  { "x": 76, "y": 9 },
  { "x": 2, "y": 1.4 },
  { "x": 100, "y": 8.3 },
  { "x": 96, "y": 1.7 },
  { "x": 68, "y": 3.9 },
  { "x": 0, "y": 3 },
  { "x": 100, "y": 4.1 },
  { "x": 16, "y": 5.5 },
  { "x": 71, "y": 6.8 },
  { "x": 100, "y": 7.9 },
  { "x": 9, "y": 6.8 },
  { "x": 85, "y": 8.3 },
  { "x": 51, "y": 6.7 },
  { "x": 95, "y": 3.8 },
  { "x": 95, "y": 4.4 },
  { "x": 1, "y": 0.2 },
  { "x": 107, "y": 9.7 },
  { "x": 50, "y": 4.2 },
  { "x": 42, "y": 9.2 },
  { "x": 35, "y": 8 },
  { "x": 44, "y": 6 },
  { "x": 64, "y": 0.7 },
  { "x": 53, "y": 3.3 },
  { "x": 92, "y": 4.1 },
  { "x": 43, "y": 7.3 },
  { "x": 15, "y": 7.5 },
  { "x": 43, "y": 4.3 },
  { "x": 90, "y": 9.9 }
]);

createSeries("Series #2", [
  { "x": 178, "y": 1.3 },
  { "x": 129, "y": 3.4 },
  { "x": 99, "y": 2.4 },
  { "x": 80, "y": 9.9 },
  { "x": 118, "y": 9.4 },
  { "x": 103, "y": 8.7 },
  { "x": 91, "y": 4.2 },
  { "x": 151, "y": 1.2 },
  { "x": 168, "y": 5.2 },
  { "x": 168, "y": 1.6 },
  { "x": 152, "y": 1.2 },
  { "x": 149, "y": 3.4 },
  { "x": 182, "y": 8.8 },
  { "x": 106, "y": 6.7 },
  { "x": 111, "y": 9.2 },
  { "x": 130, "y": 6.3 },
  { "x": 147, "y": 2.9 },
  { "x": 81, "y": 8.1 },
  { "x": 138, "y": 7.7 },
  { "x": 107, "y": 3.9 },
  { "x": 124, "y": 0.7 },
  { "x": 130, "y": 2.6 },
  { "x": 86, "y": 9.2 },
  { "x": 169, "y": 7.5 },
  { "x": 122, "y": 9.9 },
  { "x": 100, "y": 3.8 },
  { "x": 172, "y": 4.1 },
  { "x": 140, "y": 7.3 },
  { "x": 161, "y": 2.3 },
  { "x": 141, "y": 0.9 }
]);

createSeries("Series #3", [
  { "x": 419, "y": 4.9 },
  { "x": 417, "y": 5.5 },
  { "x": 434, "y": 0.1 },
  { "x": 344, "y": 2.5 },
  { "x": 279, "y": 7.5 },
  { "x": 307, "y": 8.4 },
  { "x": 279, "y": 9 },
  { "x": 220, "y": 8.4 },
  { "x": 204, "y": 8 },
  { "x": 446, "y": 0.9 },
  { "x": 397, "y": 8.9 },
  { "x": 351, "y": 1.7 },
  { "x": 393, "y": 0.7 },
  { "x": 254, "y": 1.8 },
  { "x": 260, "y": 0.4 },
  { "x": 300, "y": 3.5 },
  { "x": 199, "y": 2.7 },
  { "x": 182, "y": 5.8 },
  { "x": 173, "y": 2 },
  { "x": 201, "y": 9.7 },
  { "x": 288, "y": 1.2 },
  { "x": 333, "y": 7.4 },
  { "x": 308, "y": 1.9 },
  { "x": 330, "y": 8 },
  { "x": 408, "y": 1.7 },
  { "x": 274, "y": 0.8 },
  { "x": 296, "y": 3.1 },
  { "x": 279, "y": 4.3 },
  { "x": 379, "y": 5.6 },
  { "x": 175, "y": 6.8 }
]);

// Add legend
https://www.amcharts.com/docs/v5/charts/xy-chart/legend-xy-series/
var legend = chart.children.push(am5.Legend.new(root, {
  x: am5.p50,
  centerX: am5.p50
}));
legend.data.setAll(chart.series.values);

// Animate chart and series in
// https://www.amcharts.com/docs/v5/concepts/animations/#Initial_animation
chart.appear(1000, 100);

}); // end am5.ready()
</script>

<!-- HTML -->
<div id="chartdiv"></div>