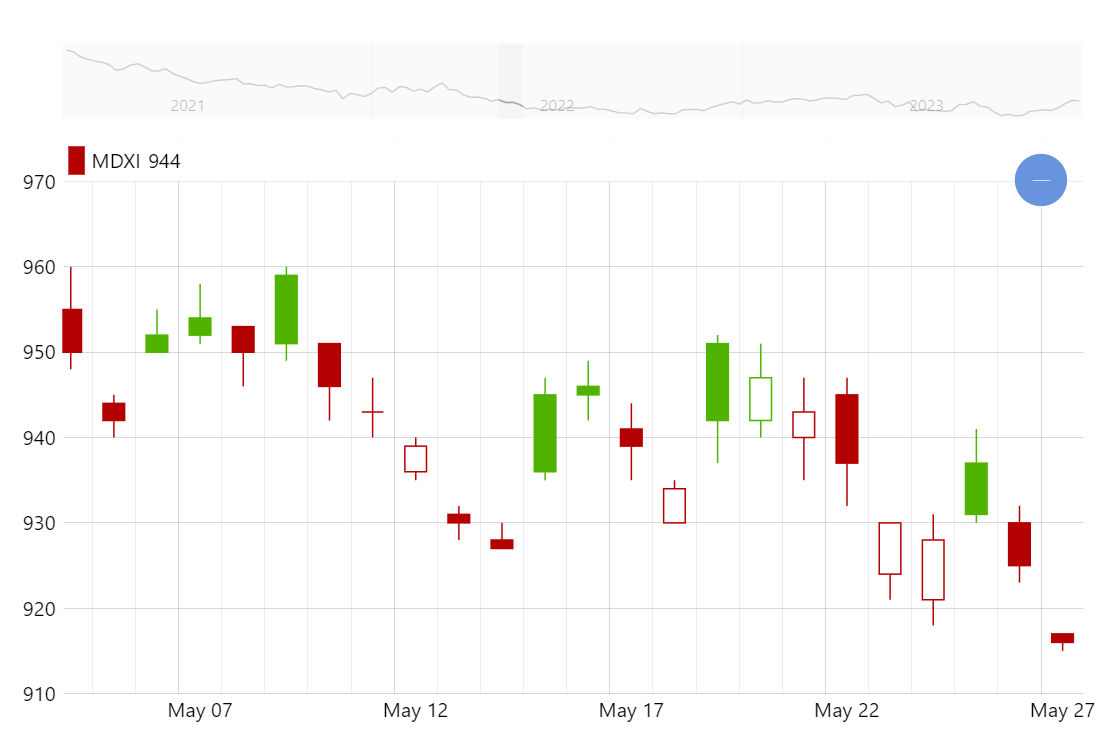
Professional Candlesticks
Professional candlestick chart is similar to the “regular” candlestick chart but applies different coloring logic. You may notice that some candlesticks are filled and some are hollow. More about this type of candlesticks can be found in the docs.
Key implementation details
Everything that is needed to turn normal candlestick into professional candlestick chart is built-in and you just have to push a pro tag into the column’s template.
series.columns.template.get("themeTags").push("pro");
Related tutorials
Demo source
<!-- Styles -->
<style>
#chartdiv {
  width: 100%;
  height: 500px;
max-width: 100%
}
</style>

<!-- Resources -->
<script src="https://cdn.amcharts.com/lib/5/index.js"></script>
<script src="https://cdn.amcharts.com/lib/5/xy.js"></script>
<script src="https://cdn.amcharts.com/lib/5/themes/Animated.js"></script>

<!-- Chart code -->
<script>
am5.ready(function() {

// Create root element
// https://www.amcharts.com/docs/v5/getting-started/#Root_element
var root = am5.Root.new("chartdiv");

const myTheme = am5.Theme.new(root);

myTheme.rule("Grid", ["scrollbar", "minor"]).setAll({
  visible:false
});

root.setThemes([
  am5themes_Animated.new(root),
  myTheme
]);
function generateChartData() {
  var chartData = [];
  var firstDate = new Date();
  firstDate.setDate(firstDate.getDate() - 1000);
  firstDate.setHours(0, 0, 0, 0);
  var value = 1200;
  for (var i = 0; i < 1000; i++) {
    var newDate = new Date(firstDate);
    newDate.setDate(newDate.getDate() + i);

    value += Math.round((Math.random() < 0.5 ? 1 : -1) * Math.random() * 10);
    var open = value + Math.round(Math.random() * 16 - 7);
    var low = Math.min(value, open) - Math.round(Math.random() * 5);
    var high = Math.max(value, open) + Math.round(Math.random() * 5);

    chartData.push({
      date: newDate.getTime(),
      value: value,
      open: open,
      low: low,
      high: high
    });
  }
  return chartData;
}

var data = generateChartData();

// Create chart
// https://www.amcharts.com/docs/v5/charts/xy-chart/
var chart = root.container.children.push(
  am5xy.XYChart.new(root, {
    focusable: true,
    panX: true,
    panY: true,
    wheelX: "panX",
    wheelY: "zoomX",
    paddingLeft: 0
  })
);

// Create axes
// https://www.amcharts.com/docs/v5/charts/xy-chart/axes/
var xAxis = chart.xAxes.push(
  am5xy.DateAxis.new(root, {
    maxDeviation: 0.5,
    groupData: true,
    baseInterval: { timeUnit: "day", count: 1 },
    renderer: am5xy.AxisRendererX.new(root, {
      pan: "zoom",
      minorGridEnabled: true
    }),
    tooltip: am5.Tooltip.new(root, {
      themeTags: ["axis"],
      animationDuration: 300
    })
  })
);

var yAxis = chart.yAxes.push(
  am5xy.ValueAxis.new(root, {
    maxDeviation: 1,
    renderer: am5xy.AxisRendererY.new(root, { pan: "zoom" })
  })
);

var color = root.interfaceColors.get("background");

// Add series
// https://www.amcharts.com/docs/v5/charts/xy-chart/series/
var series = chart.series.push(
  am5xy.CandlestickSeries.new(root, {
    fill: color,
    calculateAggregates: true,
    stroke: color,
    name: "MDXI",
    xAxis: xAxis,
    yAxis: yAxis,
    valueYField: "value",
    openValueYField: "open",
    lowValueYField: "low",
    highValueYField: "high",
    valueXField: "date",
    lowValueYGrouped: "low",
    highValueYGrouped: "high",
    openValueYGrouped: "open",
    valueYGrouped: "close",
    legendValueText: "open: {openValueY} low: {lowValueY} high: {highValueY} close: {valueY}",
    legendRangeValueText: "{valueYClose}",
    tooltip: am5.Tooltip.new(root, {
      pointerOrientation: "horizontal",
      labelText: "open: {openValueY}\nlow: {lowValueY}\nhigh: {highValueY}\nclose: {valueY}"
    })
  })
);

// make professional
series.columns.template.get("themeTags").push("pro");

// Add cursor
// https://www.amcharts.com/docs/v5/charts/xy-chart/cursor/
var cursor = chart.set(
  "cursor",
  am5xy.XYCursor.new(root, {
    xAxis: xAxis
  })
);
cursor.lineY.set("visible", false);

// Stack axes vertically
// https://www.amcharts.com/docs/v5/charts/xy-chart/axes/#Stacked_axes
chart.leftAxesContainer.set("layout", root.verticalLayout);

// Add scrollbar
// https://www.amcharts.com/docs/v5/charts/xy-chart/scrollbars/
var scrollbar = am5xy.XYChartScrollbar.new(root, {
  orientation: "horizontal",
  height: 50
});
chart.set("scrollbarX", scrollbar);

var sbxAxis = scrollbar.chart.xAxes.push(
  am5xy.DateAxis.new(root, {
    groupData: true,
    groupIntervals: [{ timeUnit: "week", count: 1 }],
    baseInterval: { timeUnit: "day", count: 1 },
    renderer: am5xy.AxisRendererX.new(root, {
      opposite: false,
      strokeOpacity: 0,
      minorGridEnabled: true
    })
  })
);

var sbyAxis = scrollbar.chart.yAxes.push(
  am5xy.ValueAxis.new(root, {
    renderer: am5xy.AxisRendererY.new(root, {})
  })
);

var sbseries = scrollbar.chart.series.push(
  am5xy.LineSeries.new(root, {
    xAxis: sbxAxis,
    yAxis: sbyAxis,
    valueYField: "value",
    valueXField: "date"
  })
);

// Add legend
// https://www.amcharts.com/docs/v5/charts/xy-chart/legend-xy-series/
var legend = yAxis.axisHeader.children.push(am5.Legend.new(root, {}));

legend.data.push(series);

legend.markers.template.setAll({
  width: 10
});

legend.markerRectangles.template.setAll({
  cornerRadiusTR: 0,
  cornerRadiusBR: 0,
  cornerRadiusTL: 0,
  cornerRadiusBL: 0
});

// set data
sbseries.data.setAll(data);
series.data.setAll(data);

// Make stuff animate on load
// https://www.amcharts.com/docs/v5/concepts/animations/
series.appear(1000);
chart.appear(1000, 100);

}); // end am5.ready()
</script>

<!-- HTML -->
<div id="chartdiv"></div>