Radar Chart
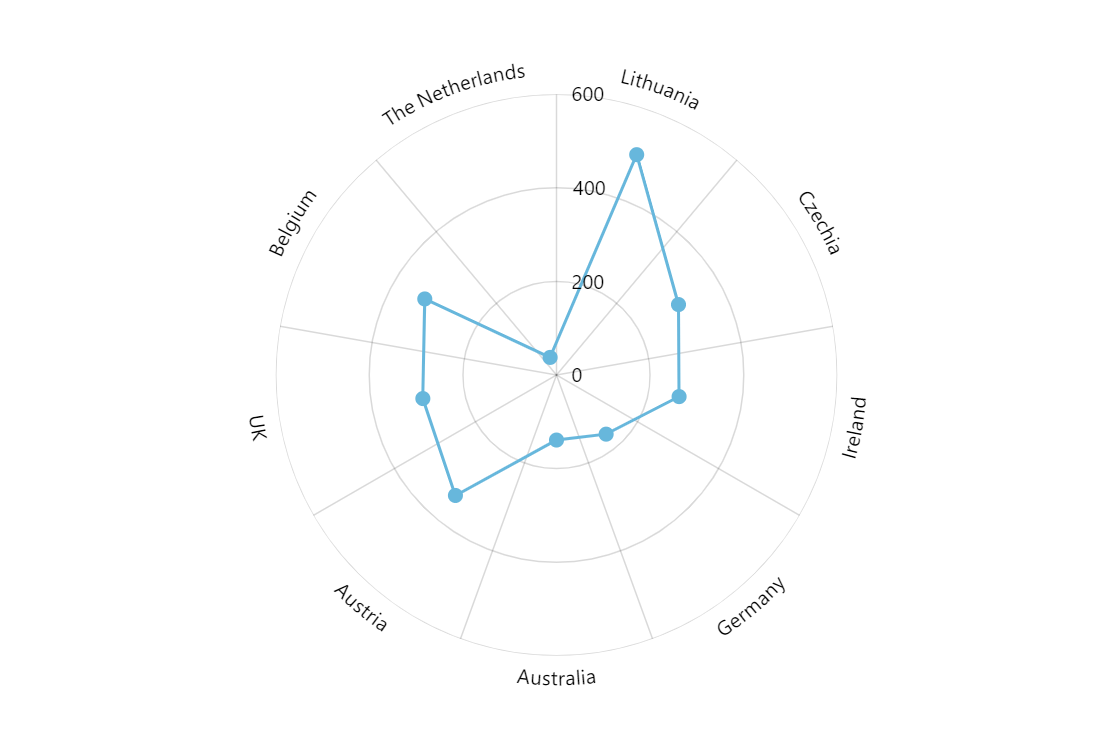
Radar chart (also known as web chart, spider chart, star chart, etc.) is used to display data as circular two-dimensional plots. In the scope of amCharts you can think of radar charts as circular XY charts with a lot of the same concepts applicable throughout.
Key implementation details
We start by creating an instance of RadarChart. The key point when adding axes to a radar chart is using special axis renderers. For the circular X axis (countries in this example) we use AxisRendererCircular and for the value axis (Y) we use AxisRendererRadial. Then we use RadarLineSeries for the actual plot.
Related tutorials
Demo source
<!-- Styles -->
<style>
#chartdiv {
  width: 100%;
  height: 500px;
}
</style>

<!-- Resources -->
<script src="https://cdn.amcharts.com/lib/5/index.js"></script>
<script src="https://cdn.amcharts.com/lib/5/xy.js"></script>
<script src="https://cdn.amcharts.com/lib/5/radar.js"></script>
<script src="https://cdn.amcharts.com/lib/5/themes/Animated.js"></script>

<!-- Chart code -->
<script>
am5.ready(function() {

// Create root element
// https://www.amcharts.com/docs/v5/getting-started/#Root_element
var root = am5.Root.new("chartdiv");


// Set themes
// https://www.amcharts.com/docs/v5/concepts/themes/
root.setThemes([
  am5themes_Animated.new(root)
]);


// Create chart
// https://www.amcharts.com/docs/v5/charts/radar-chart/
var chart = root.container.children.push(am5radar.RadarChart.new(root, {
  panX: false,
  panY: false,
  wheelX: "panX",
  wheelY: "zoomX"
}));

// Add cursor
// https://www.amcharts.com/docs/v5/charts/radar-chart/#Cursor
var cursor = chart.set("cursor", am5radar.RadarCursor.new(root, {
  behavior: "zoomX"
}));

cursor.lineY.set("visible", false);


// Create axes and their renderers
// https://www.amcharts.com/docs/v5/charts/radar-chart/#Adding_axes
var xRenderer = am5radar.AxisRendererCircular.new(root, {});
xRenderer.labels.template.setAll({
  radius: 10
});

var xAxis = chart.xAxes.push(am5xy.CategoryAxis.new(root, {
  maxDeviation: 0,
  categoryField: "country",
  renderer: xRenderer,
  tooltip: am5.Tooltip.new(root, {})
}));

var yAxis = chart.yAxes.push(am5xy.ValueAxis.new(root, {
  renderer: am5radar.AxisRendererRadial.new(root, {})
}));


// Create series
// https://www.amcharts.com/docs/v5/charts/radar-chart/#Adding_series
var series = chart.series.push(am5radar.RadarLineSeries.new(root, {
  name: "Series",
  xAxis: xAxis,
  yAxis: yAxis,
  valueYField: "litres",
  categoryXField: "country",
  tooltip:am5.Tooltip.new(root, {
    labelText:"{valueY}"
  })
}));

series.strokes.template.setAll({
  strokeWidth: 2
});

series.bullets.push(function () {
  return am5.Bullet.new(root, {
    sprite: am5.Circle.new(root, {
      radius: 5,
      fill: series.get("fill")
    })
  });
});


// Set data
// https://www.amcharts.com/docs/v5/charts/radar-chart/#Setting_data
var data = [{
  "country": "Lithuania",
  "litres": 501
}, {
  "country": "Czechia",
  "litres": 301
}, {
  "country": "Ireland",
  "litres": 266
}, {
  "country": "Germany",
  "litres": 165
}, {
  "country": "Australia",
  "litres": 139
}, {
  "country": "Austria",
  "litres": 336
}, {
  "country": "UK",
  "litres": 290
}, {
  "country": "Belgium",
  "litres": 325
}, {
  "country": "The Netherlands",
  "litres": 40
}];
series.data.setAll(data);
xAxis.data.setAll(data);


// Animate chart and series in
// https://www.amcharts.com/docs/v5/concepts/animations/#Initial_animation
series.appear(1000);
chart.appear(1000, 100);

}); // end am5.ready()
</script>

<!-- HTML -->
<div id="chartdiv"></div>