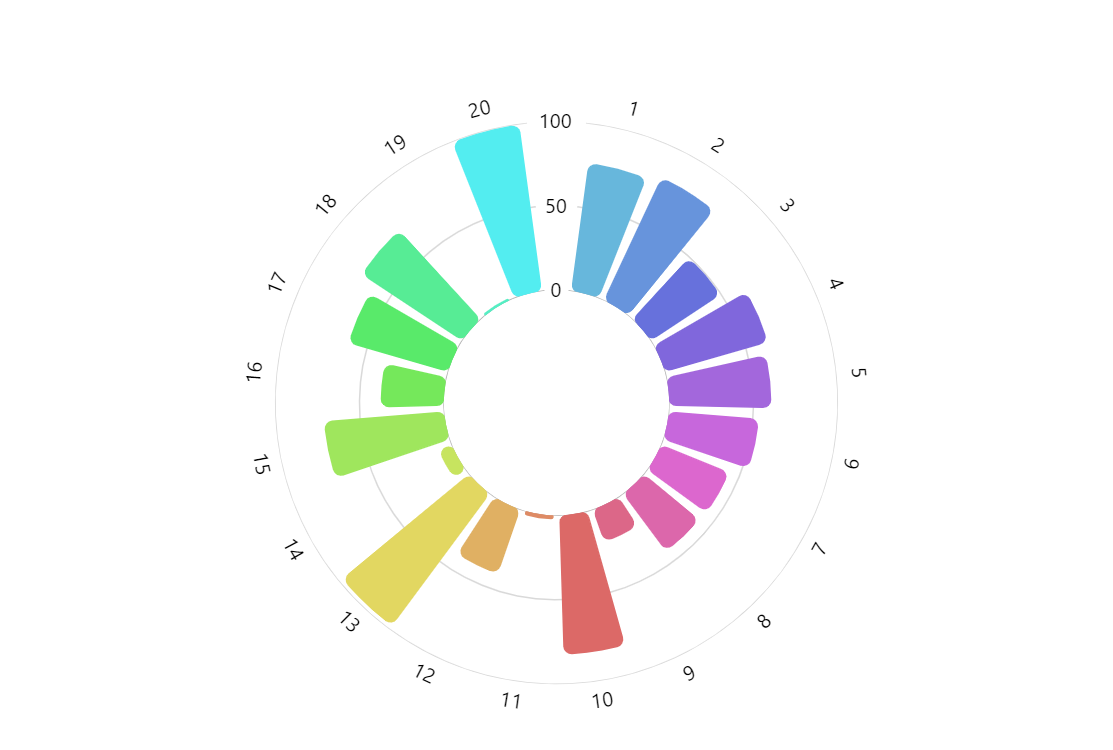
Radial Histogram
Radial Histogram (also known as Circular Histogram, Circular Bar Chart, Angular Histogram, Polar Histogram) is a variation of a bar chart where every bar is displayed along a circle. Compared to traditional linear bar charts this results in more eye-catchy visualizations with an ability to display more bars in the same space. On the negative side, these charts are harder to read and make it difficult to compare values at distant locations along the axis.
Related tutorials
Demo source
<!-- Styles -->
<style>
#chartdiv {
  width: 100%;
  height: 500px;
}
</style>

<!-- Resources -->
<script src="https://cdn.amcharts.com/lib/5/index.js"></script>
<script src="https://cdn.amcharts.com/lib/5/xy.js"></script>
<script src="https://cdn.amcharts.com/lib/5/radar.js"></script>
<script src="https://cdn.amcharts.com/lib/5/themes/Animated.js"></script>

<!-- Chart code -->
<script>
am5.ready(function() {

// Create root element
// https://www.amcharts.com/docs/v5/getting-started/#Root_element
var root = am5.Root.new("chartdiv");


// Set themes
// https://www.amcharts.com/docs/v5/concepts/themes/
root.setThemes([
  am5themes_Animated.new(root)
]);


// Create chart
// https://www.amcharts.com/docs/v5/charts/xy-chart/
var chart = root.container.children.push(am5radar.RadarChart.new(root, {
  panX: false,
  panY: false,
  wheelX: "none",
  wheelY: "none",
  startAngle: -84,
  endAngle: 264,
  innerRadius: am5.percent(40)
}));


// Add cursor
// https://www.amcharts.com/docs/v5/charts/xy-chart/cursor/
const cursor = chart.set("cursor", am5radar.RadarCursor.new(root, {
  behavior: "zoomX"
}));
cursor.lineY.set("forceHidden", true);


// Add scrollbar
// https://www.amcharts.com/docs/v5/charts/xy-chart/scrollbars/
chart.set("scrollbarX", am5.Scrollbar.new(root, {
  orientation: "horizontal",
  exportable: false
}));

// Create axes
// https://www.amcharts.com/docs/v5/charts/xy-chart/axes/
var xRenderer = am5radar.AxisRendererCircular.new(root, {
  minGridDistance: 30
});

xRenderer.grid.template.set("forceHidden", true);

var xAxis = chart.xAxes.push(am5xy.CategoryAxis.new(root, {
  maxDeviation: 0,
  categoryField: "category",
  renderer: xRenderer
}));

var yRenderer = am5radar.AxisRendererRadial.new(root, {});
yRenderer.labels.template.set("centerX", am5.p50);

var yAxis = chart.yAxes.push(am5xy.ValueAxis.new(root, {
  maxDeviation: 0.3,
  min: 0,
  renderer: yRenderer
}));

// Add series
// https://www.amcharts.com/docs/v5/charts/xy-chart/series/
var series = chart.series.push(am5radar.RadarColumnSeries.new(root, {
  name: "Series 1",
  sequencedInterpolation: true,
  xAxis: xAxis,
  yAxis: yAxis,
  valueYField: "value",
  categoryXField: "category"
}));

// Rounded corners for columns
series.columns.template.setAll({
  cornerRadius: 5,
  tooltipText: "{categoryX}: {valueY}"
});

// Make each column to be of a different color
series.columns.template.adapters.add("fill", function (fill, target) {
  return chart.get("colors").getIndex(series.columns.indexOf(target));
});

series.columns.template.adapters.add("stroke", function (stroke, target) {
  return chart.get("colors").getIndex(series.columns.indexOf(target));
});


// Set data
var data = [];

for (var i = 1; i < 21; i++) {
  data.push({ category: i, value: Math.round(Math.random() * 100) });
}

xAxis.data.setAll(data);
series.data.setAll(data);


// Make stuff animate on load
// https://www.amcharts.com/docs/v5/concepts/animations/
series.appear(1000);
chart.appear(1000, 100);

}); // end am5.ready()
</script>

<!-- HTML -->
<div id="chartdiv"></div>