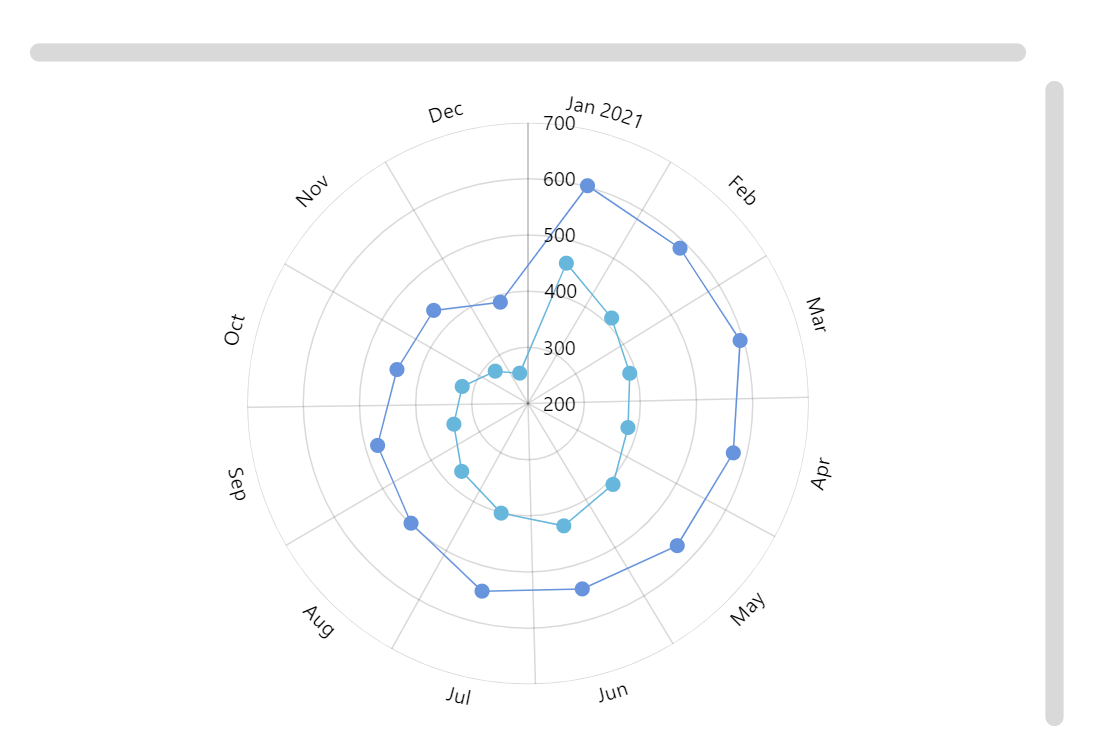
Radial Line Graph
Radial line graph (also known as Polar line chart) is useful for displaying cyclical data of several series in a circular form.
Key implementation details
We create a DateAxis as our X (circular) axis. AxisRendererCircular handles its rendering. ValueAxis is rendered by AxisRendererRadial. Then we create RadarLineSeries for our line graphs and set valueXField to date and valueYField to the respective value fields from the dataset. Finally, we add both horizontal and vertical scrollbars and they handle zooming automatically without us having to do any extra work.
Related tutorials
Demo source
<!-- Styles -->
<style>
#chartdiv {
  width: 100%;
  height: 500px
}
</style>

<!-- Resources -->
<script src="https://cdn.amcharts.com/lib/5/index.js"></script>
<script src="https://cdn.amcharts.com/lib/5/xy.js"></script>
<script src="https://cdn.amcharts.com/lib/5/radar.js"></script>
<script src="https://cdn.amcharts.com/lib/5/themes/Animated.js"></script>

<!-- Chart code -->
<script>
am5.ready(function() {

// Create root element
// https://www.amcharts.com/docs/v5/getting-started/#Root_element
var root = am5.Root.new("chartdiv");


// Set themes
// https://www.amcharts.com/docs/v5/concepts/themes/
root.setThemes([
  am5themes_Animated.new(root)
]);


// Create chart
// https://www.amcharts.com/docs/v5/charts/radar-chart/
var chart = root.container.children.push(am5radar.RadarChart.new(root, {
  panX: false,
  panY: false,
  wheelX: "panX",
  wheelY: "zoomX"
}));

// Add cursor
// https://www.amcharts.com/docs/v5/charts/radar-chart/#Cursor
var cursor = chart.set("cursor", am5radar.RadarCursor.new(root, {
  behavior: "zoomX"
}));

cursor.lineY.set("visible", false);


// Create axes and their renderers
// https://www.amcharts.com/docs/v5/charts/radar-chart/#Adding_axes
var xAxis = chart.xAxes.push(am5xy.DateAxis.new(root, {
  maxDeviation: 0.1,
  groupData: false,
  baseInterval: {
    timeUnit: "month",
    count: 1
  },
  renderer: am5radar.AxisRendererCircular.new(root, {
    minGridDistance: 50
  }),
  tooltip: am5.Tooltip.new(root, {})
}));

var yAxis = chart.yAxes.push(am5xy.ValueAxis.new(root, {
  renderer: am5radar.AxisRendererRadial.new(root, {})
}));


// Create series
// https://www.amcharts.com/docs/v5/charts/radar-chart/#Adding_series
function createSeries(name, field) {
  var series = chart.series.push(am5radar.RadarLineSeries.new(root, {
    name: name,
    xAxis: xAxis,
    yAxis: yAxis,
    valueYField: field,
    valueXField: "date",
    tooltip: am5.Tooltip.new(root, {
      labelText: "{valueY}"
    })
  }));

  series.bullets.push(function () {
    return am5.Bullet.new(root, {
      sprite: am5.Circle.new(root, {
        radius: 5,
        fill: series.get("fill")
      })
    });
  });

  return series;
}

var series1 = createSeries("Series #1", "value1");
var series2 = createSeries("Series #2", "value2");


// Add scrollbars
chart.set("scrollbarX", am5.Scrollbar.new(root, { orientation: "horizontal" }));
chart.set("scrollbarY", am5.Scrollbar.new(root, { orientation: "vertical" }));


// Generate and set data
// https://www.amcharts.com/docs/v5/charts/radar-chart/#Setting_data
var data = [];
var value1 = 500;
var value2 = 600;

for(var i = 0; i < 12; i++){
  var date = new Date();
  date.setMonth(i, 1);
  value1 -= Math.round((Math.random() < 0.5 ? 1 : -1) * Math.random() * 50);
  value2 -= Math.round((Math.random() < 0.5 ? 1 : -1) * Math.random() * 50);
  data.push({ date: date.getTime(), value1: value1, value2: value2 });
}

series1.data.setAll(data);
series2.data.setAll(data);


// Animate chart and series in
// https://www.amcharts.com/docs/v5/concepts/animations/#Initial_animation
series1.appear(1000);
series2.appear(1000);
chart.appear(1000, 100);

}); // end am5.ready()
</script>

<!-- HTML -->
<div id="chartdiv"></div>