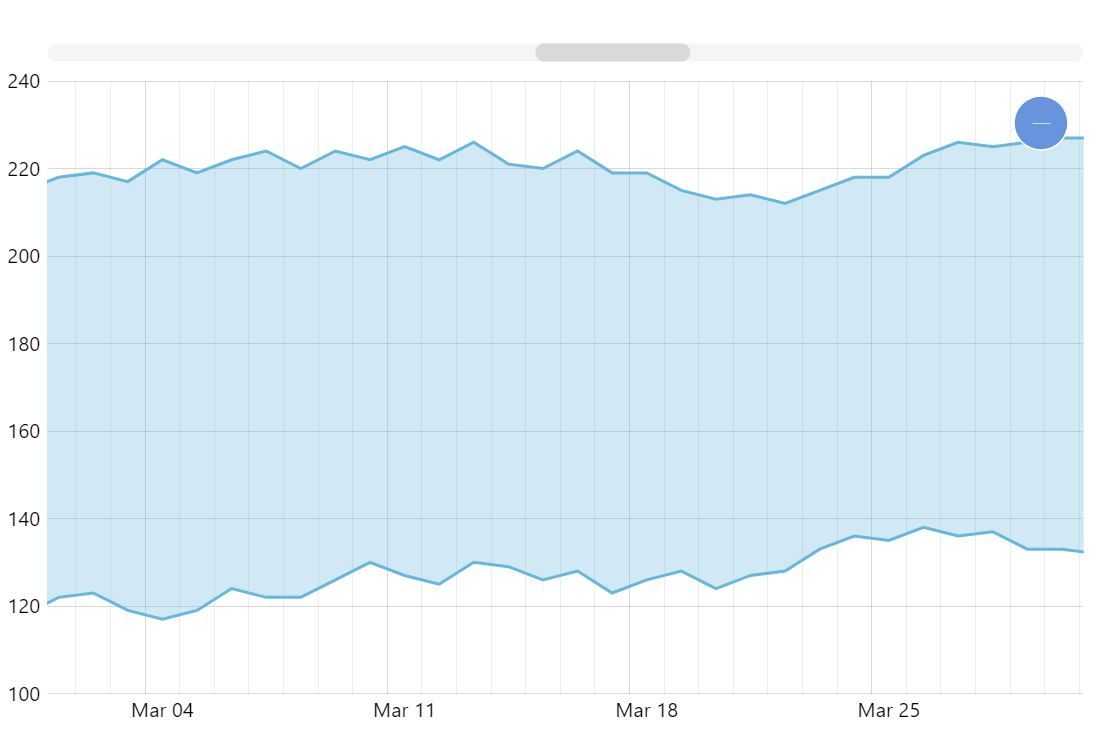
Range Area Chart
Range Area Chart is a type of area chart where rather than starting on the axis, the area is represented by the space between two values. These charts are useful for displaying ranges of values, such as between minimum and maximum prices over a timespan, or projected values for the future when the projection is represented by a range instead of a specific value.
Related tutorials
Demo source
<!-- Styles -->
<style>
#chartdiv {
  width: 100%;
  height: 500px;
}
</style>

<!-- Resources -->
<script src="https://cdn.amcharts.com/lib/5/index.js"></script>
<script src="https://cdn.amcharts.com/lib/5/xy.js"></script>
<script src="https://cdn.amcharts.com/lib/5/themes/Animated.js"></script>

<!-- Chart code -->
<script>
am5.ready(function() {


// Create root element
// https://www.amcharts.com/docs/v5/getting-started/#Root_element
var root = am5.Root.new("chartdiv");

// Set themes
// https://www.amcharts.com/docs/v5/concepts/themes/
root.setThemes([am5themes_Animated.new(root)]);

// Create chart
// https://www.amcharts.com/docs/v5/charts/xy-chart/
var chart = root.container.children.push(
  am5xy.XYChart.new(root, {
    panX: true,
    panY: true,
    wheelX: "panX",
    wheelY: "zoomX",
    pinchZoomX: true,
    paddingLeft: 0
  })
);

// Add cursor
// https://www.amcharts.com/docs/v5/charts/xy-chart/cursor/
var cursor = chart.set("cursor", am5xy.XYCursor.new(root, {
  behavior: "none"
}));
cursor.lineY.set("visible", false);

// Generate random data
var date = new Date();
date.setHours(0, 0, 0, 0);
var value0 = 100;
var value1 = 150;

function generateData() {
  value0 = Math.round(Math.random() * 10 - 5 + value0);
  value1 = Math.round(Math.random() * 10 - 5 + value1);

  if (value0 < 10) {
    value0 = 10;
  }

  if (value1 <= value0) {
    value1 = value0 + 10;
  }

  if (value1 < 10) {
    value1 = 10;
  }

  am5.time.add(date, "day", 1);
  return { date: date.getTime(), value0: value0, value1: value1 };
}

function generateDatas(count) {
  var data = [];
  for (var i = 0; i < count; ++i) {
    data.push(generateData());
  }
  return data;
}

// Create axes
// https://www.amcharts.com/docs/v5/charts/xy-chart/axes/
var xAxis = chart.xAxes.push(
  am5xy.DateAxis.new(root, {
    maxDeviation: 0.5,
    baseInterval: { timeUnit: "day", count: 1 },
    renderer: am5xy.AxisRendererX.new(root, {
      pan: "zoom",
      minorGridEnabled: true
    }),
    tooltip: am5.Tooltip.new(root, {})
  })
);

var yAxis = chart.yAxes.push(
  am5xy.ValueAxis.new(root, {
    maxDeviation: 1,
    renderer: am5xy.AxisRendererY.new(root, { pan: "zoom" })
  })
);

// Add series
// https://www.amcharts.com/docs/v5/charts/xy-chart/series/
var series0 = chart.series.push(
  am5xy.LineSeries.new(root, {
    name: "Series",
    xAxis: xAxis,
    yAxis: yAxis,
    valueYField: "value0",
    valueXField: "date",
    tooltip: am5.Tooltip.new(root, {
      labelText: "{valueY}",
      pointerOrientation: "horizontal"
    })
  })
);

var series1 = chart.series.push(
  am5xy.LineSeries.new(root, {
    name: "Series",
    xAxis: xAxis,
    yAxis: yAxis,
    valueYField: "value1",
    openValueYField: "value0",
    valueXField: "date",
    stroke: series0.get("stroke"),
    fill: series0.get("stroke"),
    tooltip: am5.Tooltip.new(root, {
      labelText: "{valueY}",
      pointerOrientation: "horizontal"
    })
  })
);

series1.fills.template.setAll({
  fillOpacity: 0.3,
  visible: true
});

series0.strokes.template.set("strokeWidth", 2);
series1.strokes.template.set("strokeWidth", 2);

// Add scrollbar
// https://www.amcharts.com/docs/v5/charts/xy-chart/scrollbars/
chart.set("scrollbarX", am5.Scrollbar.new(root, {
  orientation: "horizontal"
}));

var data = generateDatas(200);
series0.data.setAll(data);
series1.data.setAll(data);

// Make stuff animate on load
// https://www.amcharts.com/docs/v5/concepts/animations/
series0.appear(1000);
series1.appear(1000);
chart.appear(1000, 100);

}); // end am5.ready()
</script>

<!-- HTML -->
<div id="chartdiv"></div>