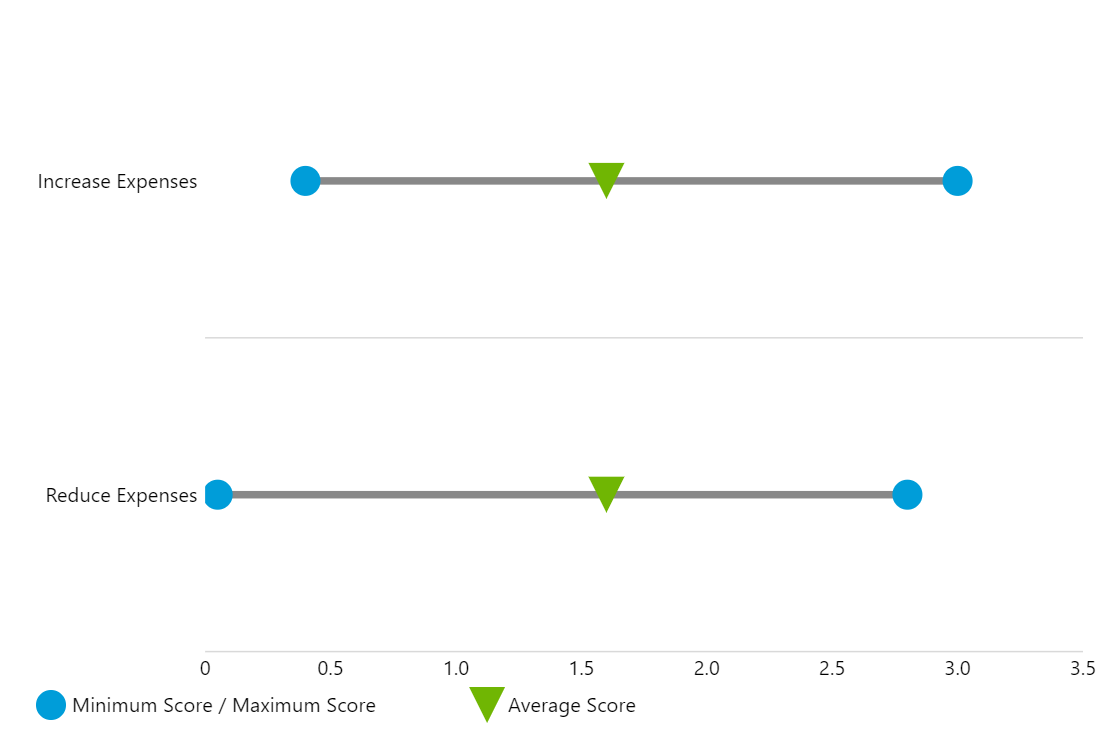
Range Bullet Chart
Bullet charts can be useful by effectively displaying some value against the target goal, for example.
Key implementation details
To create the “range line” in this demo we use a narrow ColumnSeries (horizontal bars) with its openValueXField (start position) and valueXField (end position) set to open/close values from our dataset. We add circle bullets in both of those locations by creating two bullets: one in locationX: 0 (start) and the other in locationX: 1 (end). Finally, we create a LineSeries for our triangle bullet (valueXField set to average from the dataset), set its stroke to invisible, and add a Triangle bullet to it.
Related tutorials
Demo source
<!-- Styles -->
<style>
#chartdiv {
  width: 100%;
  height: 200px;
}
</style>

<!-- Resources -->
<script src="https://cdn.amcharts.com/lib/5/index.js"></script>
<script src="https://cdn.amcharts.com/lib/5/xy.js"></script>
<script src="https://cdn.amcharts.com/lib/5/themes/Animated.js"></script>

<!-- Chart code -->
<script>
am5.ready(function() {

// Create root element
// https://www.amcharts.com/docs/v5/getting-started/#Root_element
var root = am5.Root.new("chartdiv");


// Set themes
// https://www.amcharts.com/docs/v5/concepts/themes/
root.setThemes([
  am5themes_Animated.new(root)
]);


// Create chart
// https://www.amcharts.com/docs/v5/charts/xy-chart/
var chart = root.container.children.push(am5xy.XYChart.new(root, {
  panX: false,
  panY: false,
  wheelX: "none",
  wheelY: "none",
  layout: root.verticalLayout
}));


var data = [{
  category: "Reduce Expenses",
  open: 0.05,
  close: 2.8,
  average: 1.6
}, {
  category: "Increase Expenses",
  open: 0.4,
  close: 3,
  average: 1.6
}];


// Create axes
// https://www.amcharts.com/docs/v5/charts/xy-chart/axes/
var yAxis = chart.yAxes.push(am5xy.CategoryAxis.new(root, {
  categoryField: "category",
  renderer: am5xy.AxisRendererY.new(root, {
    cellStartLocation: 0.1,
    cellEndLocation: 0.9
  }),
  tooltip: am5.Tooltip.new(root, {})
}));

yAxis.data.setAll(data);

var xAxis = chart.xAxes.push(am5xy.ValueAxis.new(root, {
  renderer: am5xy.AxisRendererX.new(root, {
    minGridDistance: 40
  })
}));

xAxis.get("renderer").grid.template.set("visible", false);


// Add series
// https://www.amcharts.com/docs/v5/charts/xy-chart/series/
var series = chart.series.push(am5xy.ColumnSeries.new(root, {
  xAxis: xAxis,
  yAxis: yAxis,
  openValueXField: "open",
  valueXField: "close",
  categoryYField: "category",
  fill: am5.color(0x888888)
}));

series.columns.template.setAll({
  height: 5
});

series.data.setAll(data);

// Add bullets
series.bullets.push(function () {
  return am5.Bullet.new(root, {
    locationX: 0,
    sprite: am5.Circle.new(root, {
      fill: am5.color(0x009dd9),
      radius: 10
    })
  });
});

series.bullets.push(function () {
  return am5.Bullet.new(root, {
    locationX: 1,
    sprite: am5.Circle.new(root, {
      fill: am5.color(0x009dd9),
      radius: 10
    })
  });
});


var series2 = chart.series.push(am5xy.LineSeries.new(root, {
  name: "Average Score",
  xAxis: xAxis,
  yAxis: yAxis,
  valueXField: "average",
  categoryYField: "category"
}));

series2.strokes.template.setAll({
  visible: false
});

series2.data.setAll(data);

// Add bullets
series2.bullets.push(function () {
  return am5.Bullet.new(root, {
    sprite: am5.Triangle.new(root, {
      fill: am5.color(0x70b603),
      rotation: 180,
      width: 24,
      height: 24
    })
  });
});


var series3 = chart.series.push(am5xy.LineSeries.new(root, {
  name: "Minimum Score / Maximum Score",
  xAxis: xAxis,
  yAxis: yAxis,
  // valueXField: "average",
  // categoryYField: "category"
}));

series3.strokes.template.setAll({
  visible: false
});

series3.data.setAll(data);

// Add bullets
series3.bullets.push(function () {
  return am5.Bullet.new(root, {
    locationX: 0,
    sprite: am5.Circle.new(root, {
      fill: am5.color(0x009dd9),
      radius: 10
    })
  });
});

// Add legend
var legend = chart.children.push(am5.Legend.new(root, {
  layout: root.horizontalLayout,
  clickTarget: "none"
}));

legend.data.setAll([series3, series2]);


// Make stuff animate on load
// https://www.amcharts.com/docs/v5/concepts/animations/
series.appear();
chart.appear(1000, 100);

}); // end am5.ready()
</script>

<!-- HTML -->
<div id="chartdiv"></div>