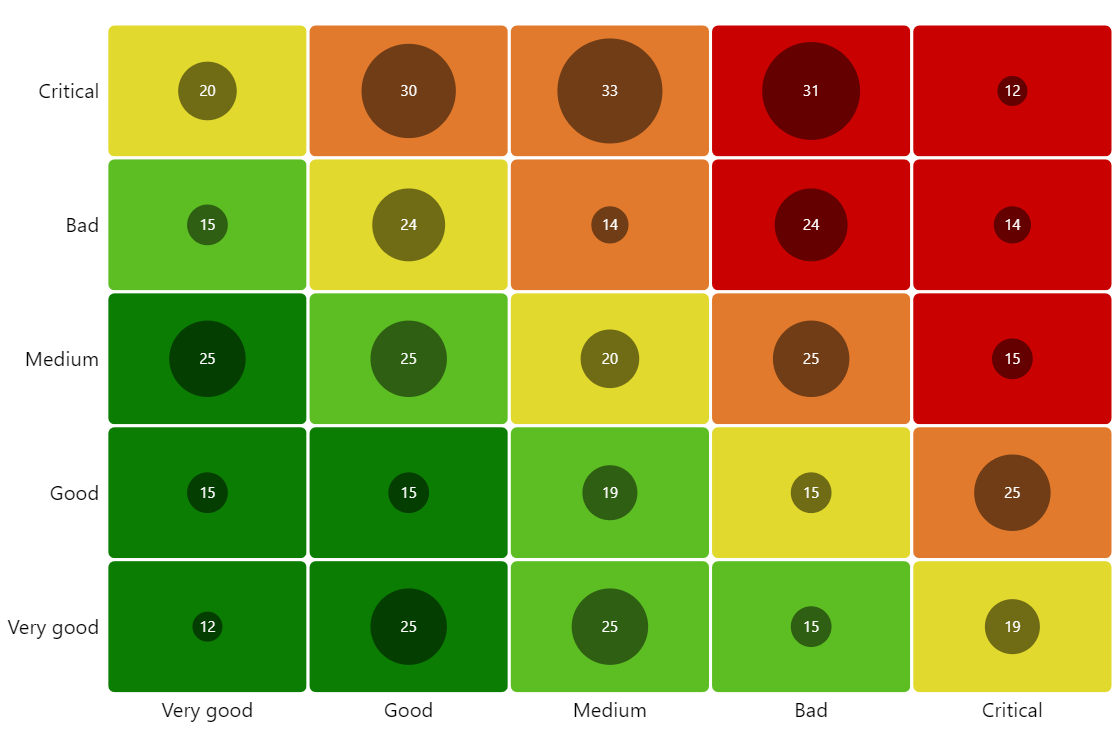
Risk Heatmap
Two-dimensional category axes
Both axes on this chart is a category axis. This allows placing columns precisely as squares.
Data-aware bullets
Bullets inside squares are bullets. Labels inside bullets are bound to the actual values in data.
Heat rules
Heat rules allow modifying element’s properties based on its related value in data. Those are not limited to colors. Any quantifiable value can be used in a heat rule, like for instance, a radius of a bullet on this chart.
Demo source
<!-- Styles -->
<style>
#chartdiv {
  width: 100%;
  height: 500px;
}
</style>

<!-- Resources -->
<script src="https://cdn.amcharts.com/lib/5/index.js"></script>
<script src="https://cdn.amcharts.com/lib/5/xy.js"></script>
<script src="https://cdn.amcharts.com/lib/5/themes/Animated.js"></script>

<!-- Chart code -->
<script>
am5.ready(function() {

// Create root element
// https://www.amcharts.com/docs/v5/getting-started/#Root_element
var root = am5.Root.new("chartdiv");

// Set themes
// https://www.amcharts.com/docs/v5/concepts/themes/
root.setThemes([
  am5themes_Animated.new(root)
]);

// Create chart
// https://www.amcharts.com/docs/v5/charts/xy-chart/
var chart = root.container.children.push(
  am5xy.XYChart.new(root, {
    panX: false,
    panY: false,
    wheelX: "none",
    wheelY: "none",
    paddingLeft: 0,
    paddingRight: 0,
    layout: root.verticalLayout
  })
);

// Create axes and their renderers
var yRenderer = am5xy.AxisRendererY.new(root, {
  visible: false,
  minGridDistance: 20,
  inversed: true,
  minorGridEnabled: true
});

yRenderer.grid.template.set("visible", false);

var yAxis = chart.yAxes.push(
  am5xy.CategoryAxis.new(root, {
    renderer: yRenderer,
    categoryField: "category"
  })
);

var xRenderer = am5xy.AxisRendererX.new(root, {
  visible: false,
  minGridDistance: 30,
  inversed: true,
  minorGridEnabled: true
});

xRenderer.grid.template.set("visible", false);

var xAxis = chart.xAxes.push(
  am5xy.CategoryAxis.new(root, {
    renderer: xRenderer,
    categoryField: "category"
  })
);

// Create series
// https://www.amcharts.com/docs/v5/charts/xy-chart/#Adding_series
var series = chart.series.push(
  am5xy.ColumnSeries.new(root, {
    calculateAggregates: true,
    stroke: am5.color(0xffffff),
    clustered: false,
    xAxis: xAxis,
    yAxis: yAxis,
    categoryXField: "x",
    categoryYField: "y",
    valueField: "value"
  })
);

series.columns.template.setAll({
  tooltipText: "{value}",
  strokeOpacity: 1,
  strokeWidth: 2,
  cornerRadiusTL: 5,
  cornerRadiusTR: 5,
  cornerRadiusBL: 5,
  cornerRadiusBR: 5,
  width: am5.percent(100),
  height: am5.percent(100),
  templateField: "columnSettings"
});

var circleTemplate = am5.Template.new({});

// Add heat rule
// https://www.amcharts.com/docs/v5/concepts/settings/heat-rules/
series.set("heatRules", [{
  target: circleTemplate,
  min: 10,
  max: 35,
  dataField: "value",
  key: "radius"
}]);

series.bullets.push(function () {
  return am5.Bullet.new(root, {
    sprite: am5.Circle.new(
      root,
      {
        fill: am5.color(0x000000),
        fillOpacity: 0.5,
        strokeOpacity: 0
      },
      circleTemplate
    )
  });
});

series.bullets.push(function () {
  return am5.Bullet.new(root, {
    sprite: am5.Label.new(root, {
      fill: am5.color(0xffffff),
      populateText: true,
      centerX: am5.p50,
      centerY: am5.p50,
      fontSize: 10,
      text: "{value}"
    })
  });
});

var colors = {
  critical: am5.color(0xca0101),
  bad: am5.color(0xe17a2d),
  medium: am5.color(0xe1d92d),
  good: am5.color(0x5dbe24),
  verygood: am5.color(0x0b7d03)
};

// Set data
// https://www.amcharts.com/docs/v5/charts/xy-chart/#Setting_data
var data = [
  {
    y: "Critical",
    x: "Very good",
    columnSettings: {
      fill: colors.medium
    },
    value: 20
  },
  {
    y: "Bad",
    x: "Very good",
    columnSettings: {
      fill: colors.good
    },
    value: 15
  },
  {
    y: "Medium",
    x: "Very good",
    columnSettings: {
      fill: colors.verygood
    },
    value: 25
  },
  {
    y: "Good",
    x: "Very good",
    columnSettings: {
      fill: colors.verygood
    },
    value: 15
  },
  {
    y: "Very good",
    x: "Very good",
    columnSettings: {
      fill: colors.verygood
    },
    value: 12
  },
  {
    y: "Critical",
    x: "Good",
    columnSettings: {
      fill: colors.bad
    },
    value: 30
  },
  {
    y: "Bad",
    x: "Good",
    columnSettings: {
      fill: colors.medium
    },
    value: 24
  },
  {
    y: "Medium",
    x: "Good",
    columnSettings: {
      fill: colors.good
    },
    value: 25
  },
  {
    y: "Good",
    x: "Good",
    columnSettings: {
      fill: colors.verygood
    },
    value: 15
  },
  {
    y: "Very good",
    x: "Good",
    columnSettings: {
      fill: colors.verygood
    },
    value: 25
  },
  {
    y: "Critical",
    x: "Medium",
    columnSettings: {
      fill: colors.bad
    },
    value: 33
  },
  {
    y: "Bad",
    x: "Medium",
    columnSettings: {
      fill: colors.bad
    },
    value: 14
  },
  {
    y: "Medium",
    x: "Medium",
    columnSettings: {
      fill: colors.medium
    },
    value: 20
  },
  {
    y: "Good",
    x: "Medium",
    columnSettings: {
      fill: colors.good
    },
    value: 19
  },
  {
    y: "Very good",
    x: "Medium",
    columnSettings: {
      fill: colors.good
    },
    value: 25
  },
  {
    y: "Critical",
    x: "Bad",
    columnSettings: {
      fill: colors.critical
    },
    value: 31
  },
  {
    y: "Bad",
    x: "Bad",
    columnSettings: {
      fill: colors.critical
    },
    value: 24
  },
  {
    y: "Medium",
    x: "Bad",
    columnSettings: {
      fill: colors.bad
    },
    value: 25
  },
  {
    y: "Good",
    x: "Bad",
    columnSettings: {
      fill: colors.medium
    },
    value: 15
  },
  {
    y: "Very good",
    x: "Bad",
    columnSettings: {
      fill: colors.good
    },
    value: 15
  },
  {
    y: "Critical",
    x: "Critical",
    columnSettings: {
      fill: colors.critical
    },
    value: 12
  },
  {
    y: "Bad",
    x: "Critical",
    columnSettings: {
      fill: colors.critical
    },
    value: 14
  },
  {
    y: "Medium",
    x: "Critical",
    columnSettings: {
      fill: colors.critical
    },
    value: 15
  },
  {
    y: "Good",
    x: "Critical",
    columnSettings: {
      fill: colors.bad
    },
    value: 25
  },
  {
    y: "Very good",
    x: "Critical",
    columnSettings: {
      fill: colors.medium
    },
    value: 19
  }
];

series.data.setAll(data);

yAxis.data.setAll([
  { category: "Critical" },
  { category: "Bad" },
  { category: "Medium" },
  { category: "Good" },
  { category: "Very good" }
]);

xAxis.data.setAll([
  { category: "Critical" },
  { category: "Bad" },
  { category: "Medium" },
  { category: "Good" },
  { category: "Very good" }
]);

// Make stuff animate on load
// https://www.amcharts.com/docs/v5/concepts/animations/#Initial_animation
chart.appear(1000, 100);

}); // end am5.ready()
</script>

<!-- HTML -->
<div id="chartdiv"></div>