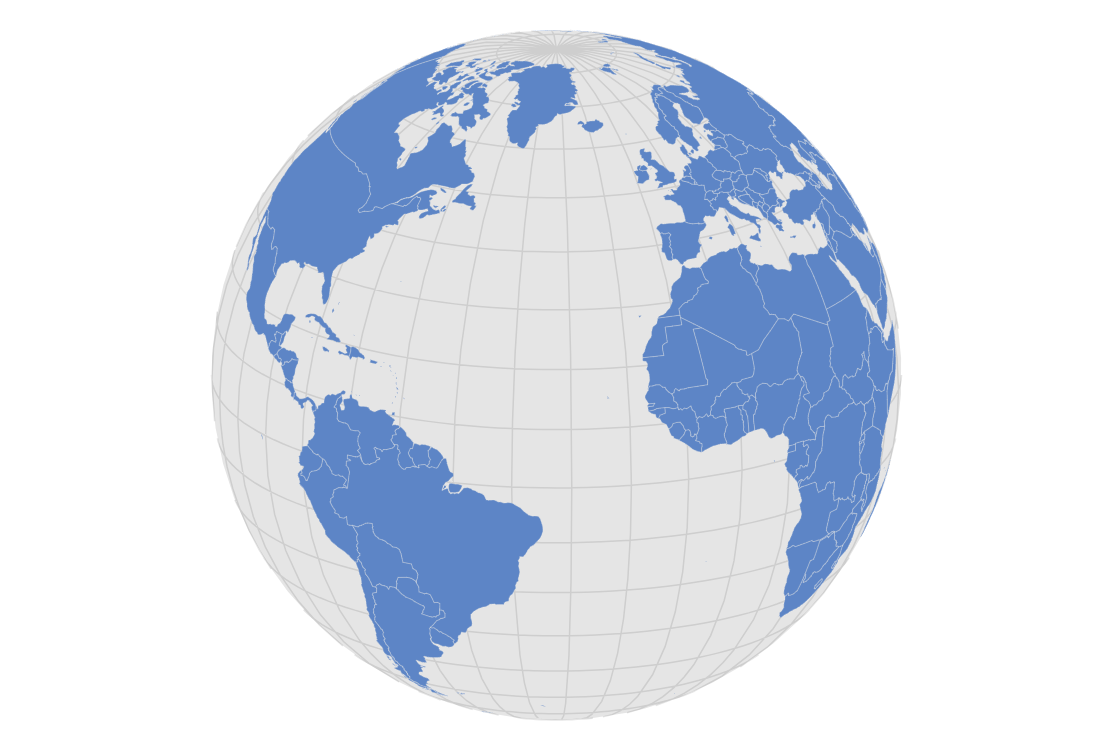
Rotate Globe to a Selected Country
One of the cool features of amCharts Maps is that you can display the world map as a globe. This, however, means that not all countries are in view all the time. This demo shows how to rotate the globe to a country.
Click on any country for the globe to center it.
Key implementation details
When the country polygon becomes selected (active) we get its geometric center with geoCentroid() and then animate the map chart to the latitude/longitude of that point.
Related tutorials
Demo source
<!-- Styles -->
<style>
#chartdiv {
  width: 100%;
  height: 500px;
  max-width: 100%;
}
</style>

<!-- Resources -->
<script src="https://cdn.amcharts.com/lib/5/index.js"></script>
<script src="https://cdn.amcharts.com/lib/5/map.js"></script>
<script src="https://cdn.amcharts.com/lib/5/geodata/worldLow.js"></script>
<script src="https://cdn.amcharts.com/lib/5/themes/Animated.js"></script>

<!-- Chart code -->
<script>
am5.ready(function() {

// Create root element
// https://www.amcharts.com/docs/v5/getting-started/#Root_element
var root = am5.Root.new("chartdiv");


// Set themes
// https://www.amcharts.com/docs/v5/concepts/themes/
root.setThemes([
  am5themes_Animated.new(root)
]);


// Create the map chart
// https://www.amcharts.com/docs/v5/charts/map-chart/
var chart = root.container.children.push(am5map.MapChart.new(root, {
  panX: "rotateX",
  panY: "rotateY",
  projection: am5map.geoOrthographic(),
  paddingBottom: 20,
  paddingTop: 20,
  paddingLeft: 20,
  paddingRight: 20
}));


// Create main polygon series for countries
// https://www.amcharts.com/docs/v5/charts/map-chart/map-polygon-series/
var polygonSeries = chart.series.push(am5map.MapPolygonSeries.new(root, {
  geoJSON: am5geodata_worldLow
}));

polygonSeries.mapPolygons.template.setAll({
  tooltipText: "{name}",
  toggleKey: "active",
  interactive: true
});

polygonSeries.mapPolygons.template.states.create("hover", {
  fill: root.interfaceColors.get("primaryButtonHover")
});

polygonSeries.mapPolygons.template.states.create("active", {
  fill: root.interfaceColors.get("primaryButtonHover")
});


// Create series for background fill
// https://www.amcharts.com/docs/v5/charts/map-chart/map-polygon-series/#Background_polygon
var backgroundSeries = chart.series.push(am5map.MapPolygonSeries.new(root, {}));
backgroundSeries.mapPolygons.template.setAll({
  fill: root.interfaceColors.get("alternativeBackground"),
  fillOpacity: 0.1,
  strokeOpacity: 0
});
backgroundSeries.data.push({
  geometry: am5map.getGeoRectangle(90, 180, -90, -180)
});

var graticuleSeries = chart.series.unshift(
  am5map.GraticuleSeries.new(root, {
    step: 10
  })
);

graticuleSeries.mapLines.template.set("strokeOpacity", 0.1)

// Set up events
var previousPolygon;

polygonSeries.mapPolygons.template.on("active", function(active, target) {
  if (previousPolygon && previousPolygon != target) {
    previousPolygon.set("active", false);
  }
  if (target.get("active")) {
    selectCountry(target.dataItem.get("id"));
  }
  previousPolygon = target;
});

function selectCountry(id) {
  var dataItem = polygonSeries.getDataItemById(id);
  var target = dataItem.get("mapPolygon");
  if (target) {
    var centroid = target.geoCentroid();
    if (centroid) {
      chart.animate({ key: "rotationX", to: -centroid.longitude, duration: 1500, easing: am5.ease.inOut(am5.ease.cubic) });
      chart.animate({ key: "rotationY", to: -centroid.latitude, duration: 1500, easing: am5.ease.inOut(am5.ease.cubic) });
    }
  }
}

// Uncomment this to pre-center the globe on a country when it loads
//polygonSeries.events.on("datavalidated", function() {
//  selectCountry("AU");
//});


// Make stuff animate on load
chart.appear(1000, 100);

}); // end am5.ready()
</script>

<!-- HTML -->
<div id="chartdiv"></div>