Rotating Globe
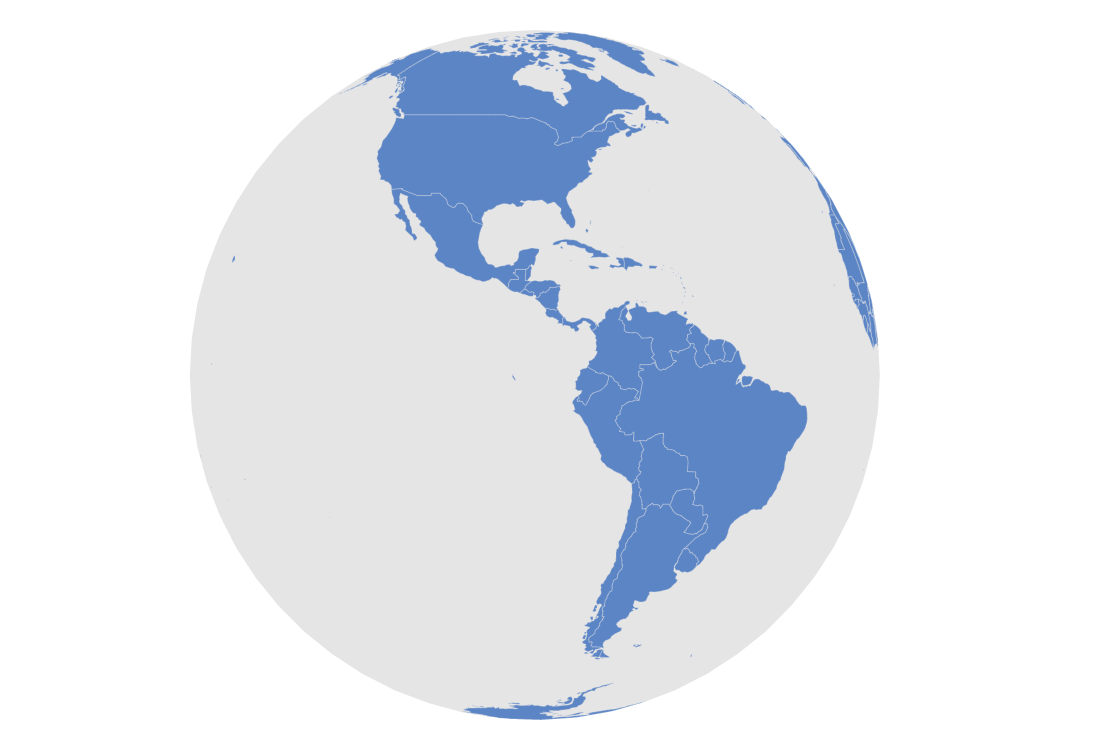
Orthographic projection
Orthographic projection allows projection of any map in a globe-like shape.
Go ahead and try to rotate the map! Click and drag to rotate, use mouse wheel to zoom in and out.
Implementation details
We create our MapChart with projection set to geoOrthographic (projection: am5map.geoOrthographic()).
Related demos
Related tutorials
Demo source
<!-- Styles -->
<style>
#chartdiv {
  width: 100%;
  height: 500px;
  max-width: 100%;
}
</style>

<!-- Resources -->
<script src="https://cdn.amcharts.com/lib/5/index.js"></script>
<script src="https://cdn.amcharts.com/lib/5/map.js"></script>
<script src="https://cdn.amcharts.com/lib/5/geodata/worldLow.js"></script>
<script src="https://cdn.amcharts.com/lib/5/themes/Animated.js"></script>

<!-- Chart code -->
<script>
am5.ready(function() {

// Create root element
// https://www.amcharts.com/docs/v5/getting-started/#Root_element
var root = am5.Root.new("chartdiv");


// Set themes
// https://www.amcharts.com/docs/v5/concepts/themes/
root.setThemes([
  am5themes_Animated.new(root)
]);


// Create the map chart
// https://www.amcharts.com/docs/v5/charts/map-chart/
var chart = root.container.children.push(am5map.MapChart.new(root, {
  panX: "rotateX",
  panY: "rotateY",
  projection: am5map.geoOrthographic(),
  paddingBottom: 20,
  paddingTop: 20,
  paddingLeft: 20,
  paddingRight: 20
}));


// Create main polygon series for countries
// https://www.amcharts.com/docs/v5/charts/map-chart/map-polygon-series/
var polygonSeries = chart.series.push(am5map.MapPolygonSeries.new(root, {
  geoJSON: am5geodata_worldLow
}));

polygonSeries.mapPolygons.template.setAll({
  tooltipText: "{name}",
  toggleKey: "active",
  interactive: true
});

polygonSeries.mapPolygons.template.states.create("hover", {
  fill: root.interfaceColors.get("primaryButtonHover")
});


// Create series for background fill
// https://www.amcharts.com/docs/v5/charts/map-chart/map-polygon-series/#Background_polygon
var backgroundSeries = chart.series.push(am5map.MapPolygonSeries.new(root, {}));
backgroundSeries.mapPolygons.template.setAll({
  fill: root.interfaceColors.get("alternativeBackground"),
  fillOpacity: 0.1,
  strokeOpacity: 0
});
backgroundSeries.data.push({
  geometry: am5map.getGeoRectangle(90, 180, -90, -180)
});


// Create graticule series
// https://www.amcharts.com/docs/v5/charts/map-chart/graticule-series/
var graticuleSeries = chart.series.push(am5map.GraticuleSeries.new(root, {}));
graticuleSeries.mapLines.template.setAll({ strokeOpacity: 0.1, stroke: root.interfaceColors.get("alternativeBackground") })


// Rotate animation
chart.animate({
  key: "rotationX",
  from: 0,
  to: 360,
  duration: 30000,
  loops: Infinity
});


// Make stuff animate on load
chart.appear(1000, 100);

}); // end am5.ready()
</script>

<!-- HTML -->
<div id="chartdiv"></div>