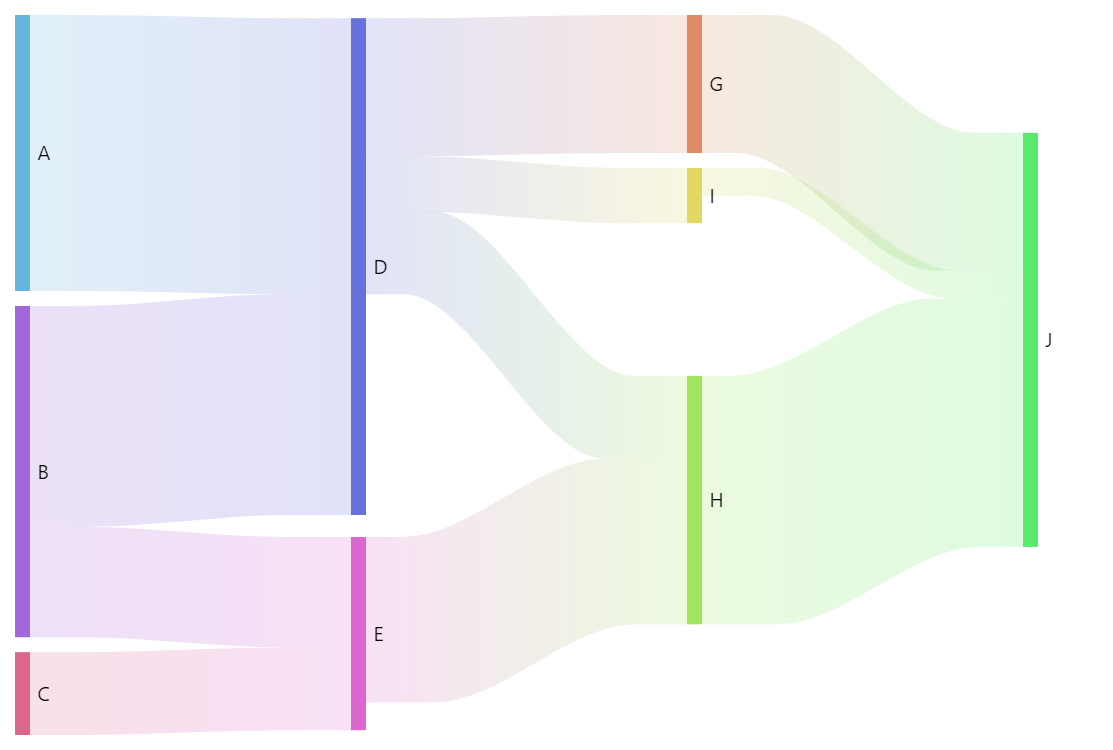
Sankey Diagram
Sankey diagram is a perfect chart to show the flow and relation between stages of a process.
amCharts 5 implementation of Sankey diagram allows flexible configuration of nodes and links, dragging and toggling of nodes, as well as some other tricks.
Related tutorials
Demo source
<!-- Styles -->
<style>
#chartdiv {
  width: 100%;
  height: 500px;
}
</style>

<!-- Resources -->
<script src="https://cdn.amcharts.com/lib/5/index.js"></script>
<script src="https://cdn.amcharts.com/lib/5/flow.js"></script>
<script src="https://cdn.amcharts.com/lib/5/themes/Animated.js"></script>

<!-- Chart code -->
<script>
am5.ready(function() {

// Create root element
// https://www.amcharts.com/docs/v5/getting-started/#Root_element
var root = am5.Root.new("chartdiv");


// Set themes
// https://www.amcharts.com/docs/v5/concepts/themes/
root.setThemes([
  am5themes_Animated.new(root)
]);


// Create series
// https://www.amcharts.com/docs/v5/charts/flow-charts/
var series = root.container.children.push(am5flow.Sankey.new(root, {
  sourceIdField: "from",
  targetIdField: "to",
  valueField: "value",
  paddingRight: 50
}));

series.nodes.get("colors").set("step", 2);


// Set data
// https://www.amcharts.com/docs/v5/charts/flow-charts/#Setting_data
series.data.setAll([
  { from: "A", to: "D", value: 10 },
  { from: "B", to: "D", value: 8 },
  { from: "B", to: "E", value: 4 },
  { from: "C", to: "E", value: 3 },
  { from: "D", to: "G", value: 5 },
  { from: "D", to: "I", value: 2 },
  { from: "D", to: "H", value: 3 },
  { from: "E", to: "H", value: 6 },
  { from: "G", to: "J", value: 5 },
  { from: "I", to: "J", value: 1 },
  { from: "H", to: "J", value: 9 }
]);


// Make stuff animate on load
series.appear(1000, 100);

}); // end am5.ready()
</script>

<!-- HTML -->
<div id="chartdiv"></div>