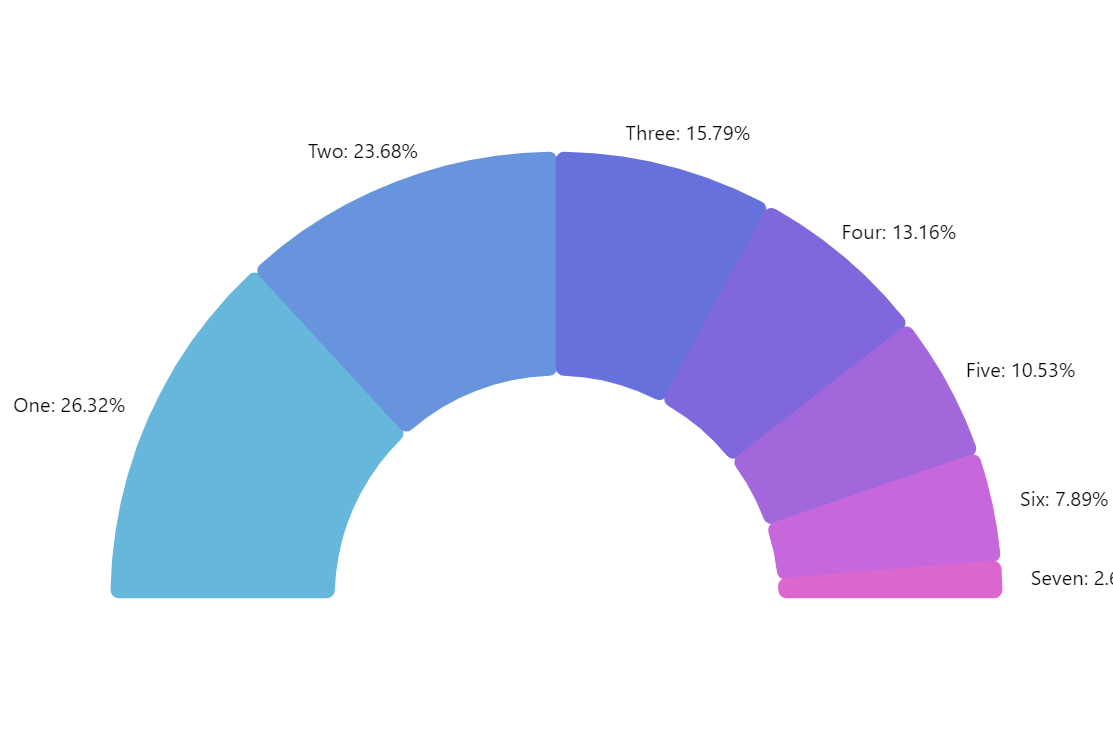
Semi-Circle Pie Chart
The main advantage of the Semi-Circle Pie Chart (also known as Semi-circle donut chart, Half pie chart) is that it takes two times less space than the regular Pie or Donut Chart for the same amount of data displayed.
Flexible pie chart
Pie chart is not limited to a full circle. You can set any angle for it to start on and any angle to end on. The chart will take care of the rest.
The chart’s properties startAngle and endAngle are responsible for it.
Related tutorials
Demo source
<!-- Styles -->
<style>
#chartdiv {
  width: 100%;
  height: 550px;
}
</style>

<!-- Resources -->
<script src="https://cdn.amcharts.com/lib/5/index.js"></script>
<script src="https://cdn.amcharts.com/lib/5/percent.js"></script>
<script src="https://cdn.amcharts.com/lib/5/themes/Animated.js"></script>

<!-- Chart code -->
<script>
am5.ready(function() {

// Create root element
// https://www.amcharts.com/docs/v5/getting-started/#Root_element
var root = am5.Root.new("chartdiv");

// Set themes
// https://www.amcharts.com/docs/v5/concepts/themes/
root.setThemes([
  am5themes_Animated.new(root)
]);

// Create chart
// https://www.amcharts.com/docs/v5/charts/percent-charts/pie-chart/
// start and end angle must be set both for chart and series
var chart = root.container.children.push(am5percent.PieChart.new(root, {
  startAngle: 180,
  endAngle: 360,
  layout: root.verticalLayout,
  innerRadius: am5.percent(50)
}));

// Create series
// https://www.amcharts.com/docs/v5/charts/percent-charts/pie-chart/#Series
// start and end angle must be set both for chart and series
var series = chart.series.push(am5percent.PieSeries.new(root, {
  startAngle: 180,
  endAngle: 360,
  valueField: "value",
  categoryField: "category",
  alignLabels: false
}));

series.states.create("hidden", {
  startAngle: 180,
  endAngle: 180
});

series.slices.template.setAll({
  cornerRadius: 5
});

series.ticks.template.setAll({
  forceHidden: true
});

// Set data
// https://www.amcharts.com/docs/v5/charts/percent-charts/pie-chart/#Setting_data
series.data.setAll([
  { value: 10, category: "One" },
  { value: 9, category: "Two" },
  { value: 6, category: "Three" },
  { value: 5, category: "Four" },
  { value: 4, category: "Five" },
  { value: 3, category: "Six" },
  { value: 1, category: "Seven" }
]);

series.appear(1000, 100);

}); // end am5.ready()
</script>

<!-- HTML -->
<div id="chartdiv"></div>