Show Percentage Change
If your data already has percent values, then all you need to do is to add % sign to the y axis labels, for this you set number format on the axis:
var yAxis = chart.yAxes.push(am5xy.ValueAxis.new(root, {numberFormat: "#'%'", renderer: am5xy.AxisRendererY.new(root, {}) }));
If your values are not recalculated to percent, there are two options:
1) show the change in percent when first value in the selection is used as a base value. This way first value in the selection will always be 0.
For this, two settings must be added to series:
calculateAggregates: true,valueYShow: "valueYChangePercent"
2) show the change is percent when first value of your data is used as a base value:
For this, two settings must be added to series:
calculateAggregates: true, valueYShow: "valueYChangePercent"
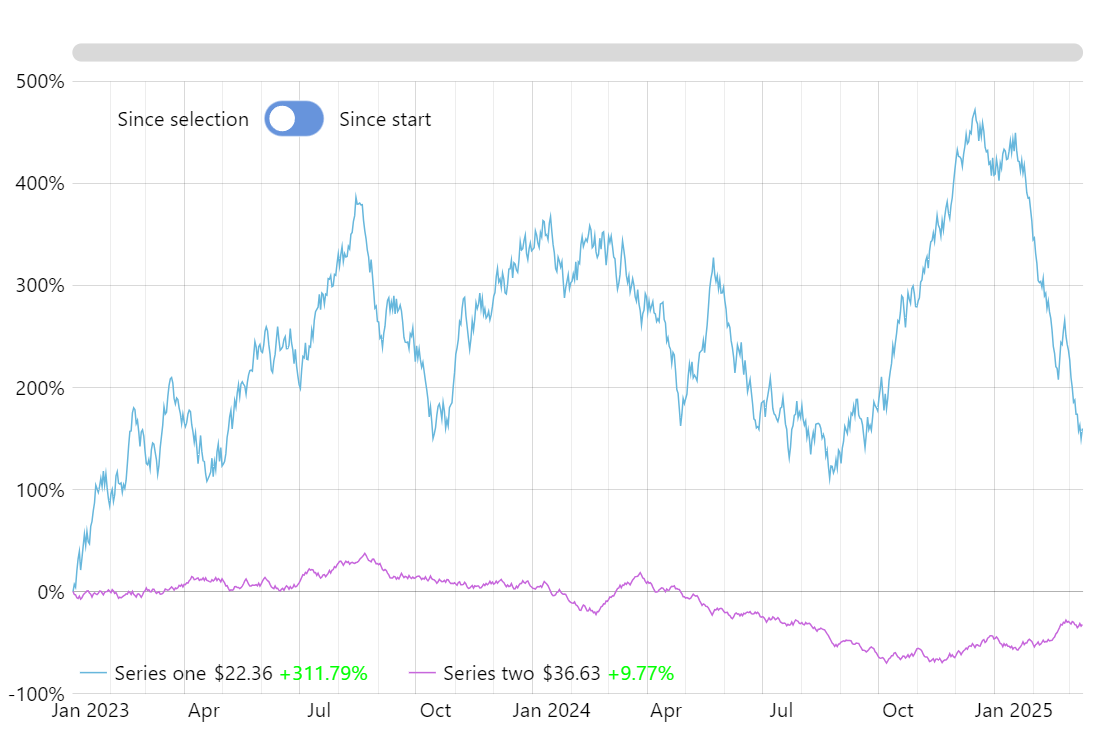
You might want to adjust what you show in a tooltip and legend value. Check the source of this demo – when a switch at the top of a chart is toggled, the chart changes from one mode to another changing tooltip and legend text as well.
Related tutorials
Demo source
<!-- Styles -->
<style>
#chartdiv {
  width: 100%;
  height: 500px;
max-width: 100%
}
</style>

<!-- Resources -->
<script src="https://cdn.amcharts.com/lib/5/index.js"></script>
<script src="https://cdn.amcharts.com/lib/5/xy.js"></script>
<script src="https://cdn.amcharts.com/lib/5/themes/Animated.js"></script>

<!-- Chart code -->
<script>
am5.ready(function() {

// Create root element
// https://www.amcharts.com/docs/v5/getting-started/#Root_element
var root = am5.Root.new("chartdiv");


// Set themes
// https://www.amcharts.com/docs/v5/concepts/themes/
root.setThemes([
  am5themes_Animated.new(root)
]);


// Create chart
// https://www.amcharts.com/docs/v5/charts/xy-chart/
var chart = root.container.children.push(am5xy.XYChart.new(root, {
  panX: true,
  panY: true,
  wheelX: "panX",
  wheelY: "zoomX",
  pinchZoomX: true,
  paddingLeft: 0
}));

chart.get("colors").set("step", 5);

var legend = chart.plotContainer.children.push(am5.Legend.new(root, {
  centerY: am5.p100,
  y: am5.p100
}));

legend.valueLabels.template.set("width", 120);


// Add cursor
// https://www.amcharts.com/docs/v5/charts/xy-chart/cursor/
var cursor = chart.set("cursor", am5xy.XYCursor.new(root, {
  behavior: "none"
}));
cursor.lineY.set("visible", false);


// Generate random data
var date = new Date();
var value = 0;

function generateData() {
  value = am5.math.round((Math.random() * 2 - 1) + value, 2);
  am5.time.add(date, "day", 1);
  return {
    date: date.getTime(),
    value: value
  };
}

function generateDatas(count) {
  value = Math.random() * 50;
  date.setFullYear(2023, 0, 1);
  date.setHours(0, 0, 0, 0);
  var data = [];
  for (var i = 0; i < count; ++i) {
    data.push(generateData());
  }
  return data;
}


// Create axes
// https://www.amcharts.com/docs/v5/charts/xy-chart/axes/
var xAxis = chart.xAxes.push(am5xy.DateAxis.new(root, {
  maxDeviation: 0.2,
  baseInterval: {
    timeUnit: "day",
    count: 1
  },
  renderer: am5xy.AxisRendererX.new(root, {
    minorGridEnabled: true,
    minGridDistance: 70
  }),
  tooltip: am5.Tooltip.new(root, {})
}));

var yAxis = chart.yAxes.push(am5xy.ValueAxis.new(root, {
  renderer: am5xy.AxisRendererY.new(root, {
    pan: "zoom"
  }),
  numberFormat: "#'%'"
}));


function createSeries(name) {
  var tooltip = am5.Tooltip.new(root, {
    getStrokeFromSprite: true,
    getFillFromSprite: false,
    labelText: "${valueY} {valueYChangeSelectionPercent.formatNumber('[#0f0]+0.00|[#f00]0.00|[#000]0.00')}%"
  })

  tooltip.get("background").setAll({
    fill: am5.color(0xffffff)
  })

  // Add series
  // https://www.amcharts.com/docs/v5/charts/xy-chart/series/
  var series = chart.series.push(am5xy.LineSeries.new(root, {
    name: name,
    xAxis: xAxis,
    yAxis: yAxis,
    calculateAggregates: true,
    valueYField: "value",
    valueXField: "date",
    valueYShow: "valueYChangeSelectionPercent",
    legendValueText: "${valueY} {valueYChangeSelectionPercent.formatNumber('[#0f0]+0.00|[#f00]0.00|[#000]0.00')}%",
    tooltip: tooltip
  }));

  // Set data
  var data = generateDatas(800);
  series.data.setAll(data);
  series.appear(1000);

  legend.data.push(series);
}

createSeries("Series one");
createSeries("Series two");


// Add scrollbar
// https://www.amcharts.com/docs/v5/charts/xy-chart/scrollbars/
chart.set("scrollbarX", am5.Scrollbar.new(root, {
  orientation: "horizontal"
}));


// switch button
var cont = chart.plotContainer.children.push(am5.Container.new(root, {
  layout: root.horizontalLayout,
  x: 20,
  y: 25
}));

// Add labels and controls
cont.children.push(am5.Label.new(root, {
  centerY: am5.p50,
  text: "Since selection"
}));

var switchButton = cont.children.push(am5.Button.new(root, {
  themeTags: ["switch"],
  centerY: am5.p50,
  icon: am5.Circle.new(root, {
    themeTags: ["icon"]
  })
}));

switchButton.on("active", function () {
  if (!switchButton.get("active")) {
    chart.series.each(function (series) {
      series.set("valueYShow", "valueYChangeSelectionPercent");
      series.set("legendValueText", "${valueY} {valueYChangeSelectionPercent.formatNumber('[#0f0]+0.00|[#f00]0.00|[#000]0.00')}%");
      series.get("tooltip").set("labelText", "${valueY} {valueYChangeSelectionPercent.formatNumber('[#0f0]+0.00|[#f00]0.00|[#000]0.00')}%");
    })
  } else {
    chart.series.each(function (series) {
      series.set("valueYShow", "valueYChangePercent")
      series.set("legendValueText", "${valueY} {valueYChangePercent.formatNumber('[#0f0]+0.00|[#f00]0.00|[#000]0.00')}%");
      series.get("tooltip").set("labelText", "${valueY} {valueYChangePercent.formatNumber('[#0f0]+0.00|[#f00]0.00|[#000]0.00')}%");
    })
  }
});

cont.children.push(
  am5.Label.new(root, {
    centerY: am5.p50,
    text: "Since start"
  })
);

// Make stuff animate on load
// https://www.amcharts.com/docs/v5/concepts/animations/

chart.appear(1000, 100);

}); // end am5.ready()
</script>

<!-- HTML -->
<div id="chartdiv"></div>