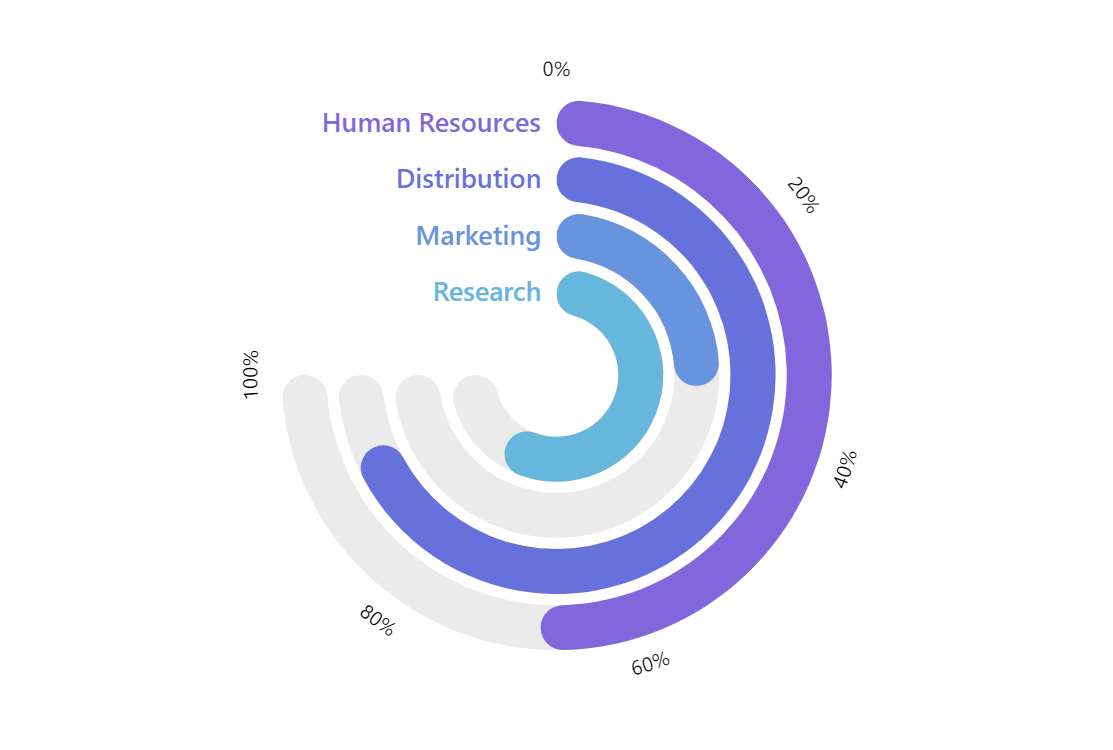
Solid Gauge
Solid Gauge Chart is similar to the Angular Gauge Chart and is most commonly used to mimic real-world gauges. The main difference from the Angular Gauge Chart is that the values are displayed by a filled portion of a gauge scale rather than a hand of a mechanical-like gauge.
Related tutorials
Demo source
<!-- Styles -->
<style>
#chartdiv {
  width: 100%;
  height: 500px;
}
</style>

<!-- Resources -->
<script src="https://cdn.amcharts.com/lib/5/index.js"></script>
<script src="https://cdn.amcharts.com/lib/5/xy.js"></script>
<script src="https://cdn.amcharts.com/lib/5/radar.js"></script>
<script src="https://cdn.amcharts.com/lib/5/themes/Animated.js"></script>

<!-- Chart code -->
<script>
am5.ready(function() {

// Create root element
// https://www.amcharts.com/docs/v5/getting-started/#Root_element
var root = am5.Root.new("chartdiv");

// Set themes
// https://www.amcharts.com/docs/v5/concepts/themes/
root.setThemes([
  am5themes_Animated.new(root)
]);

// Create chart
// https://www.amcharts.com/docs/v5/charts/radar-chart/
var chart = root.container.children.push(am5radar.RadarChart.new(root, {
  panX: false,
  panY: false,
  wheelX: "panX",
  wheelY: "zoomX",
  innerRadius: am5.percent(20),
  startAngle: -90,
  endAngle: 180
}));


// Data
var data = [{
  category: "Research",
  value: 80,
  full: 100,
  columnSettings: {
    fill: chart.get("colors").getIndex(0)
  }
}, {
  category: "Marketing",
  value: 35,
  full: 100,
  columnSettings: {
    fill: chart.get("colors").getIndex(1)
  }
}, {
  category: "Distribution",
  value: 92,
  full: 100,
  columnSettings: {
    fill: chart.get("colors").getIndex(2)
  }
}, {
  category: "Human Resources",
  value: 68,
  full: 100,
  columnSettings: {
    fill: chart.get("colors").getIndex(3)
  }
}];

// Add cursor
// https://www.amcharts.com/docs/v5/charts/radar-chart/#Cursor
var cursor = chart.set("cursor", am5radar.RadarCursor.new(root, {
  behavior: "zoomX"
}));

cursor.lineY.set("visible", false);

// Create axes and their renderers
// https://www.amcharts.com/docs/v5/charts/radar-chart/#Adding_axes
var xRenderer = am5radar.AxisRendererCircular.new(root, {
  //minGridDistance: 50
});

xRenderer.labels.template.setAll({
  radius: 10
});

xRenderer.grid.template.setAll({
  forceHidden: true
});

var xAxis = chart.xAxes.push(am5xy.ValueAxis.new(root, {
  renderer: xRenderer,
  min: 0,
  max: 100,
  strictMinMax: true,
  numberFormat: "#'%'",
  tooltip: am5.Tooltip.new(root, {})
}));


var yRenderer = am5radar.AxisRendererRadial.new(root, {
  minGridDistance: 20
});

yRenderer.labels.template.setAll({
  centerX: am5.p100,
  fontWeight: "500",
  fontSize: 18,
  templateField: "columnSettings"
});

yRenderer.grid.template.setAll({
  forceHidden: true
});

var yAxis = chart.yAxes.push(am5xy.CategoryAxis.new(root, {
  categoryField: "category",
  renderer: yRenderer
}));

yAxis.data.setAll(data);


// Create series
// https://www.amcharts.com/docs/v5/charts/radar-chart/#Adding_series
var series1 = chart.series.push(am5radar.RadarColumnSeries.new(root, {
  xAxis: xAxis,
  yAxis: yAxis,
  clustered: false,
  valueXField: "full",
  categoryYField: "category",
  fill: root.interfaceColors.get("alternativeBackground")
}));

series1.columns.template.setAll({
  width: am5.p100,
  fillOpacity: 0.08,
  strokeOpacity: 0,
  cornerRadius: 20
});

series1.data.setAll(data);


var series2 = chart.series.push(am5radar.RadarColumnSeries.new(root, {
  xAxis: xAxis,
  yAxis: yAxis,
  clustered: false,
  valueXField: "value",
  categoryYField: "category"
}));

series2.columns.template.setAll({
  width: am5.p100,
  strokeOpacity: 0,
  tooltipText: "{category}: {valueX}%",
  cornerRadius: 20,
  templateField: "columnSettings"
});

series2.data.setAll(data);

// Animate chart and series in
// https://www.amcharts.com/docs/v5/concepts/animations/#Initial_animation
series1.appear(1000);
series2.appear(1000);
chart.appear(1000, 100);

}); // end am5.ready()
</script>

<!-- HTML -->
<div id="chartdiv"></div>