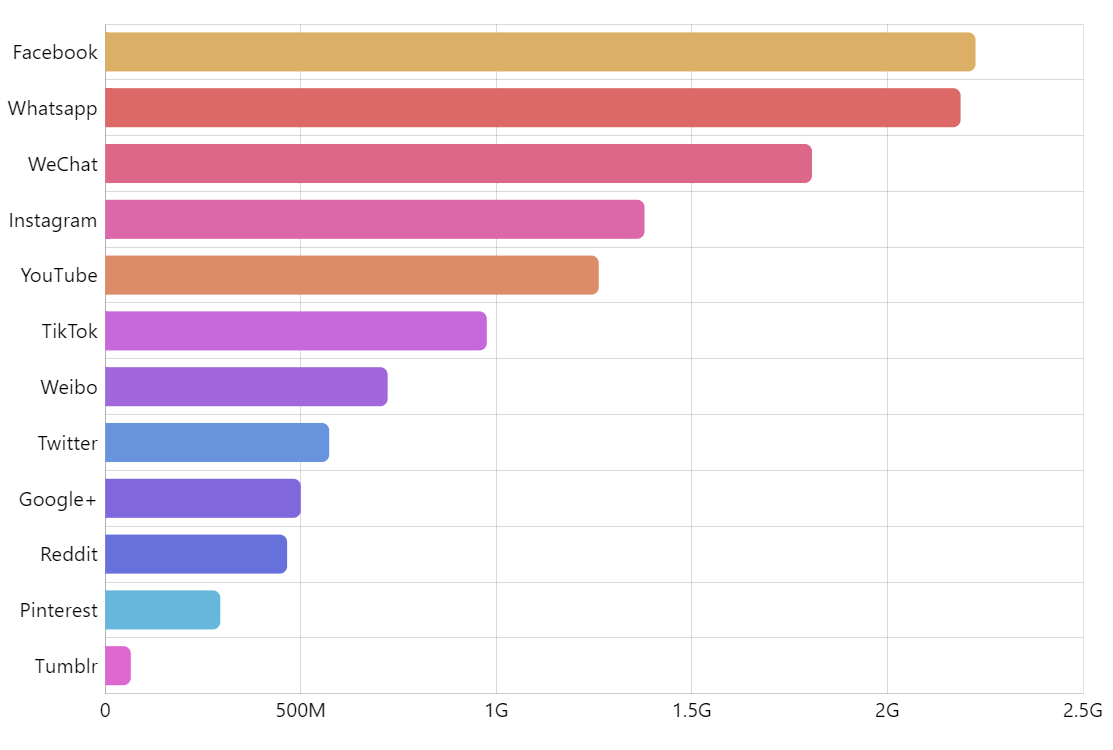
Sorted Bar Chart
Sorting a bar chart by bar’s value is a common scenario that is easily implemented by sorting the underlying data beforehand. But what if data is constantly updated? This demo shows an approach to solving the real-time sorting problem that is both functional and visually appealing.
Key implementation details
On each data update we calculate the item’s position delta and set an animation on the data-item. Then we instantly change its position based on the sort order. But when the position changes the bar doesn’t jump into its new place immediately – it goes there in a smooth animation.
Related tutorials
Demo source
<!-- Styles -->
<style>
#chartdiv {
  width: 100%;
  height: 500px;
}
</style>

<!-- Resources -->
<script src="https://cdn.amcharts.com/lib/5/index.js"></script>
<script src="https://cdn.amcharts.com/lib/5/xy.js"></script>
<script src="https://cdn.amcharts.com/lib/5/themes/Animated.js"></script>

<!-- Chart code -->
<script>
am5.ready(function() {

// Create root element
// https://www.amcharts.com/docs/v5/getting-started/#Root_element
var root = am5.Root.new("chartdiv");


// Set themes
// https://www.amcharts.com/docs/v5/concepts/themes/
root.setThemes([
  am5themes_Animated.new(root)
]);


// Create chart
// https://www.amcharts.com/docs/v5/charts/xy-chart/
var chart = root.container.children.push(am5xy.XYChart.new(root, {
  panX: false,
  panY: false,
  wheelX: "none",
  wheelY: "none",
  paddingLeft: 0
}));

// We don't want zoom-out button to appear while animating, so we hide it
chart.zoomOutButton.set("forceHidden", true);


// Create axes
// https://www.amcharts.com/docs/v5/charts/xy-chart/axes/
var yRenderer = am5xy.AxisRendererY.new(root, {
  minGridDistance: 30,
  minorGridEnabled: true
});

yRenderer.grid.template.set("location", 1);

var yAxis = chart.yAxes.push(am5xy.CategoryAxis.new(root, {
  maxDeviation: 0,
  categoryField: "network",
  renderer: yRenderer,
  tooltip: am5.Tooltip.new(root, { themeTags: ["axis"] })
}));

var xAxis = chart.xAxes.push(am5xy.ValueAxis.new(root, {
  maxDeviation: 0,
  min: 0,
  numberFormatter: am5.NumberFormatter.new(root, {
    "numberFormat": "#,###a"
  }),
  extraMax: 0.1,
  renderer: am5xy.AxisRendererX.new(root, {
    strokeOpacity: 0.1,
    minGridDistance: 80

  })
}));


// Add series
// https://www.amcharts.com/docs/v5/charts/xy-chart/series/
var series = chart.series.push(am5xy.ColumnSeries.new(root, {
  name: "Series 1",
  xAxis: xAxis,
  yAxis: yAxis,
  valueXField: "value",
  categoryYField: "network",
  tooltip: am5.Tooltip.new(root, {
    pointerOrientation: "left",
    labelText: "{valueX}"
  })
}));


// Rounded corners for columns
series.columns.template.setAll({
  cornerRadiusTR: 5,
  cornerRadiusBR: 5,
  strokeOpacity: 0
});

// Make each column to be of a different color
series.columns.template.adapters.add("fill", function (fill, target) {
  return chart.get("colors").getIndex(series.columns.indexOf(target));
});

series.columns.template.adapters.add("stroke", function (stroke, target) {
  return chart.get("colors").getIndex(series.columns.indexOf(target));
});


// Set data
var data = [
  {
    "network": "Facebook",
    "value": 2255250000
  },
  {
    "network": "Google+",
    "value": 430000000
  },
  {
    "network": "Instagram",
    "value": 1000000000
  },
  {
    "network": "Pinterest",
    "value": 246500000
  },
  {
    "network": "Reddit",
    "value": 355000000
  },
  {
    "network": "TikTok",
    "value": 500000000
  },
  {
    "network": "Tumblr",
    "value": 624000000
  },
  {
    "network": "Twitter",
    "value": 329500000
  },
  {
    "network": "WeChat",
    "value": 1000000000
  },
  {
    "network": "Weibo",
    "value": 431000000
  },
  {
    "network": "Whatsapp",
    "value": 1433333333
  },
  {
    "network": "YouTube",
    "value": 1900000000
  }
];

yAxis.data.setAll(data);
series.data.setAll(data);
sortCategoryAxis();

// Get series item by category
function getSeriesItem(category) {
  for (var i = 0; i < series.dataItems.length; i++) {
    var dataItem = series.dataItems[i];
    if (dataItem.get("categoryY") == category) {
      return dataItem;
    }
  }
}

chart.set("cursor", am5xy.XYCursor.new(root, {
  behavior: "none",
  xAxis: xAxis,
  yAxis: yAxis
}));


// Axis sorting
function sortCategoryAxis() {

  // Sort by value
  series.dataItems.sort(function (x, y) {
    return x.get("valueX") - y.get("valueX"); // descending
    //return y.get("valueY") - x.get("valueX"); // ascending
  })

  // Go through each axis item
  am5.array.each(yAxis.dataItems, function (dataItem) {
    // get corresponding series item
    var seriesDataItem = getSeriesItem(dataItem.get("category"));

    if (seriesDataItem) {
      // get index of series data item
      var index = series.dataItems.indexOf(seriesDataItem);
      // calculate delta position
      var deltaPosition = (index - dataItem.get("index", 0)) / series.dataItems.length;
      // set index to be the same as series data item index
      dataItem.set("index", index);
      // set deltaPosition instanlty
      dataItem.set("deltaPosition", -deltaPosition);
      // animate delta position to 0
      dataItem.animate({
        key: "deltaPosition",
        to: 0,
        duration: 1000,
        easing: am5.ease.out(am5.ease.cubic)
      })
    }
  });

  // Sort axis items by index.
  // This changes the order instantly, but as deltaPosition is set,
  // they keep in the same places and then animate to true positions.
  yAxis.dataItems.sort(function (x, y) {
    return x.get("index") - y.get("index");
  });
}


// update data with random values each 1.5 sec
setInterval(function () {
  updateData();
}, 1500)

function updateData() {
  am5.array.each(series.dataItems, function (dataItem) {
    var value = dataItem.get("valueX") + Math.round(Math.random() * 1000000000 - 500000000);
    if (value < 0) {
      value = 500000000;
    }
    // both valueY and workingValueY should be changed, we only animate workingValueY
    dataItem.set("valueX", value);
    dataItem.animate({
      key: "valueXWorking",
      to: value,
      duration: 600,
      easing: am5.ease.out(am5.ease.cubic)
    });
  })

  sortCategoryAxis();
}


// Make stuff animate on load
// https://www.amcharts.com/docs/v5/concepts/animations/
series.appear(1000);
chart.appear(1000, 100);

}); // end am5.ready()
</script>

<!-- HTML -->
<div id="chartdiv"></div>