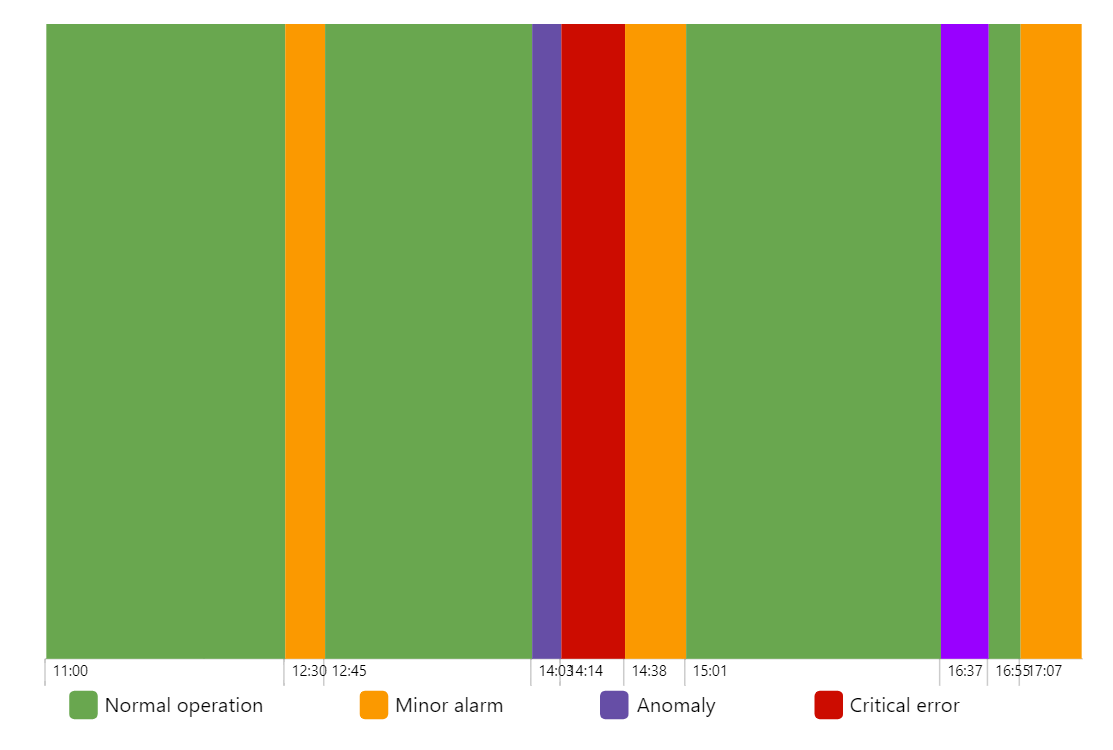
Spectrum Chart
This demo shows how we can leverage single-category ColumnSeries with floating columns, DateAxis, “axis ranges”, and “template fields” to create a Spectrum chart.
Axis range docs Template fields docs
Among other things, it also shows how chart’s Legend can be created with a totally custom items in it.
Demo source
<!-- Styles -->
<style>
#chartdiv {
  width: 100%;
  height: 120px;
}
</style>

<!-- Resources -->
<script src="https://cdn.amcharts.com/lib/5/index.js"></script>
<script src="https://cdn.amcharts.com/lib/5/xy.js"></script>
<script src="https://cdn.amcharts.com/lib/5/themes/Animated.js"></script>

<!-- Chart code -->
<script>
am5.ready(function() {

// Create root element
// https://www.amcharts.com/docs/v5/getting-started/#Root_element
var root = am5.Root.new("chartdiv");


// Set themes
// https://www.amcharts.com/docs/v5/concepts/themes/
root.setThemes([
  am5themes_Animated.new(root)
]);


// Create chart
// https://www.amcharts.com/docs/v5/charts/xy-chart/
var chart = root.container.children.push(am5xy.XYChart.new(root, {
  panX: false,
  panY: false,
  layout: root.verticalLayout
}));


// Add legend
// https://www.amcharts.com/docs/v5/charts/xy-chart/legend-xy-series/
var legend = chart.children.push(
  am5.Legend.new(root, {
    centerX: am5.p50,
    x: am5.p50
  })
);

var data = [{
  category: "",
  from: new Date(2019, 0, 1, 11, 0).getTime(),
  to: new Date(2019, 0, 1, 12, 30).getTime(),
  columnSettings: {
    fill: am5.color(0x69a74f)
  }
}, {
  category: "",
  from: new Date(2019, 0, 1, 12, 30).getTime(),
  to: new Date(2019, 0, 1, 12, 45).getTime(),
  columnSettings: {
    fill: am5.color(0xfb9900)
  }
}, {
  category: "",
  from: new Date(2019, 0, 1, 12, 45).getTime(),
  to: new Date(2019, 0, 1, 14, 3).getTime(),
  columnSettings: {
    fill: am5.color(0x69a74f)
  }
}, {
  category: "",
  from: new Date(2019, 0, 1, 14, 3).getTime(),
  to: new Date(2019, 0, 1, 14, 14).getTime(),
  columnSettings: {
    fill: am5.color(0x664ea6)
  }
}, {
  category: "",
  from: new Date(2019, 0, 1, 14, 14).getTime(),
  to: new Date(2019, 0, 1, 14, 38).getTime(),
  columnSettings: {
    fill: am5.color(0xcc0c00)
  }
}, {
  category: "",
  from: new Date(2019, 0, 1, 14, 38).getTime(),
  to: new Date(2019, 0, 1, 15, 1).getTime(),
  columnSettings: {
    fill: am5.color(0xfb9900)
  }
}, {
  category: "",
  from: new Date(2019, 0, 1, 15, 1).getTime(),
  to: new Date(2019, 0, 1, 16, 37).getTime(),
  columnSettings: {
    fill: am5.color(0x69a74f)
  }
}, {
  category: "",
  from: new Date(2019, 0, 1, 16, 37).getTime(),
  to: new Date(2019, 0, 1, 16, 55).getTime(),
  columnSettings: {
    fill: am5.color(0x9900ff)
  }
}, {
  category: "",
  from: new Date(2019, 0, 1, 16, 55).getTime(),
  to: new Date(2019, 0, 1, 17, 7).getTime(),
  columnSettings: {
    fill: am5.color(0x69a74f)
  }
}, {
  category: "",
  from: new Date(2019, 0, 1, 17, 7).getTime(),
  to: new Date(2019, 0, 1, 17, 30).getTime(),
  columnSettings: {
    fill: am5.color(0xfb9900)
  }
}];


// Create axes
// https://www.amcharts.com/docs/v5/charts/xy-chart/axes/
var yAxis = chart.yAxes.push(am5xy.CategoryAxis.new(root, {
  categoryField: "category",
  renderer: am5xy.AxisRendererY.new(root, {})
}));
yAxis.data.setAll([{ category: "" }]);


var xAxis = chart.xAxes.push(am5xy.DateAxis.new(root, {
  baseInterval: { timeUnit: "minute", count: 1 },
  renderer: am5xy.AxisRendererX.new(root, {})
}));

xAxis.get("renderer").labels.template.set("forceHidden", true);


// Add series
// https://www.amcharts.com/docs/v5/charts/xy-chart/series/
var series = chart.series.push(am5xy.ColumnSeries.new(root, {
  xAxis: xAxis,
  yAxis: yAxis,
  valueXField: "to",
  openValueXField: "from",
  categoryYField: "category"
}));

series.columns.template.setAll({
  strokeWidth: 0,
  strokeOpacity: 0,
  height: am5.percent(100),
  templateField: "columnSettings"
});

series.data.setAll(data);

// Create axis ranges for each column
// https://www.amcharts.com/docs/v5/charts/xy-chart/axes/axis-ranges/
for(var i = 0; i < data.length; i++) {
  var rangeDataItem = xAxis.makeDataItem({
    value: data[i].from
  });

  var range = xAxis.createAxisRange(rangeDataItem);

  rangeDataItem.get("grid").set("forceHidden", true);

  rangeDataItem.get("tick").setAll({
    visible: true,
    length: 18,
    strokeOpacity: 0.2
  });

  rangeDataItem.get("label").setAll({
    //fill: am5.color(0xffffff),
    centerX: am5.p0,
    forceHidden: false,
    fontSize: 10,
    text: root.dateFormatter.format(new Date(data[i].from), "HH:mm")
  });
}

// Add legend
// https://www.amcharts.com/docs/v5/charts/xy-chart/legend-xy-series/
var legend = chart.children.push(am5.Legend.new(root, {
  nameField: "name",
  fillField: "color",
  strokeField: "color",
  centerX: am5.percent(50),
  x: am5.percent(50),
  clickTarget: "none"
}));


legend.data.setAll([{
  name: "Normal operation",
  color: am5.color("#69a74f")
}, {
  name: "Minor alarm",
  color: am5.color("#fb9900")
}, {
  name: "Anomaly",
  color: am5.color("#664ea6")
}, {
  name: "Critical error",
  color: am5.color("#cc0c00")
}]);

// Make stuff animate on load
// https://www.amcharts.com/docs/v5/concepts/animations/
series.appear();
chart.appear(1000, 100);

}); // end am5.ready()
</script>

<!-- HTML -->
<div id="chartdiv"></div>