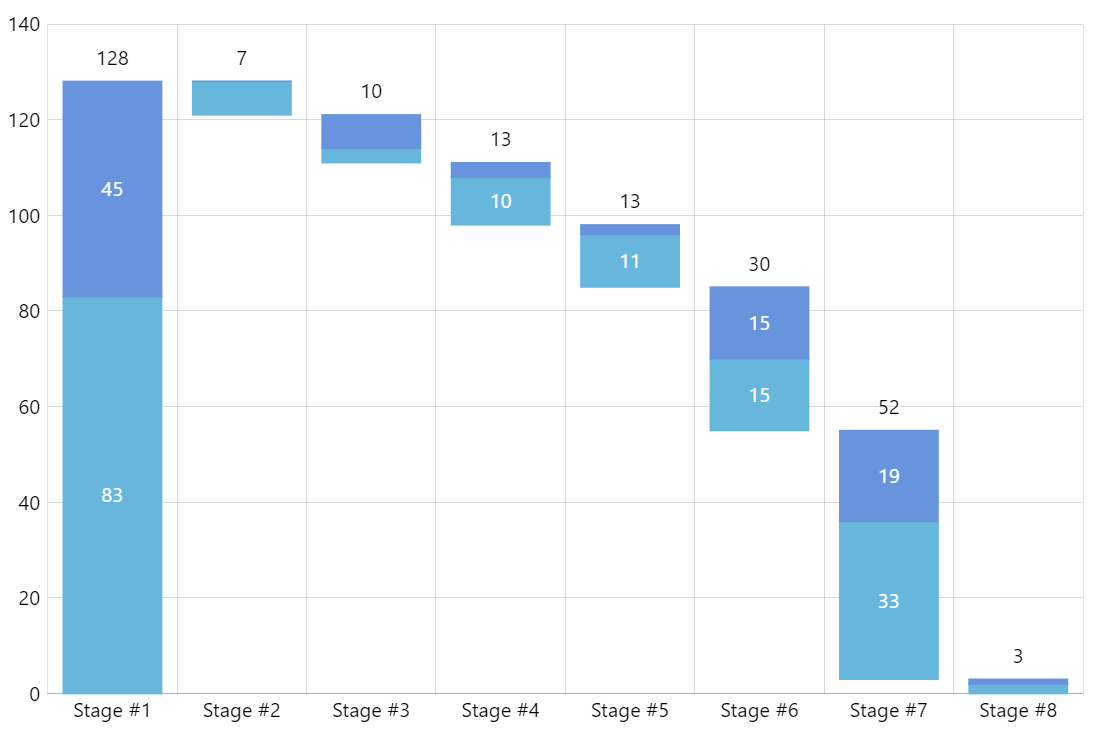
Stacked Waterfall Chart
A Waterfall Chart (also known as Flying Bricks Chart or Mario Chart or Bridge Chart) helps viewers understand the cumulative effect of sequential events. Stacking series of events gives a clearer picture of the effect of multiple parallel series.
Key implementation details
The key to implementing waterfall charts with amCharts is using the openValueYField of ColumnSeries to “suspend” the columns in the air. To get the series appear as stacked (don’t confuse with actually stacked values) we just set its clustered property to false.
Related tutorials
Demo source
<!-- Styles -->
<style>
#chartdiv {
  width: 100%;
  height: 500px;
}
</style>

<!-- Resources -->
<script src="https://cdn.amcharts.com/lib/5/index.js"></script>
<script src="https://cdn.amcharts.com/lib/5/xy.js"></script>
<script src="https://cdn.amcharts.com/lib/5/themes/Animated.js"></script>

<!-- Chart code -->
<script>
am5.ready(function() {

// Create root element
// https://www.amcharts.com/docs/v5/getting-started/#Root_element
var root = am5.Root.new("chartdiv");


// Set themes
// https://www.amcharts.com/docs/v5/concepts/themes/
root.setThemes([
  am5themes_Animated.new(root)
]);


// Create chart
// https://www.amcharts.com/docs/v5/charts/xy-chart/
var chart = root.container.children.push(am5xy.XYChart.new(root, {
  panX: false,
  panY: false,
  wheelX: "panX",
  wheelY: "zoomX",
  layout: root.verticalLayout,
  paddingLeft: 0
}));


// Data
var data = [{
  category: "Stage #1",
  open1: 0,
  close1: 83,
  open2: 83,
  close2: 128
}, {
  category: "Stage #2",
  open1: 121,
  close1: 128,
  open2: 128,
  close2: 128
}, {
  category: "Stage #3",
  open1: 111,
  close1: 114,
  open2: 114,
  close2: 121
}, {
  category: "Stage #4",
  open1: 98,
  close1: 108,
  open2: 108,
  close2: 111
}, {
  category: "Stage #5",
  open1: 85,
  close1: 96,
  open2: 96,
  close2: 98
}, {
  category: "Stage #6",
  open1: 55,
  close1: 70,
  open2: 70,
  close2: 85
}, {
  category: "Stage #7",
  open1: 3,
  close1: 36,
  open2: 36,
  close2: 55
}, {
  category: "Stage #8",
  open1: 0,
  close1: 2,
  open2: 2,
  close2: 3
}];


// Create axes
// https://www.amcharts.com/docs/v5/charts/xy-chart/axes/
var xRenderer = am5xy.AxisRendererX.new(root, {
  cellStartLocation: 0.1,
  cellEndLocation: 0.9,
  minGridDistance: 70,
  minorGridEnabled: true
});

var xAxis = chart.xAxes.push(am5xy.CategoryAxis.new(root, {
  categoryField: "category",
  renderer: xRenderer,
  tooltip: am5.Tooltip.new(root, {})
}));

xRenderer.grid.template.setAll({
  location: 1
});

xAxis.data.setAll(data);

var yAxis = chart.yAxes.push(am5xy.ValueAxis.new(root, {
  calculateTotals: true,
  extraMax: 0.05,
  renderer: am5xy.AxisRendererY.new(root, {
    strokeOpacity: 0.1
  })
}));


// Add series
// https://www.amcharts.com/docs/v5/charts/xy-chart/series/
function makeSeries(name, field, openField, total) {
  var series = chart.series.push(am5xy.ColumnSeries.new(root, {
    name: name,
    xAxis: xAxis,
    yAxis: yAxis,
    valueYField: field,
    openValueYField: openField,
    categoryXField: "category",
    clustered: false
  }));

  series.columns.template.setAll({
    tooltipText: "{name}, {categoryX}: {valueY}",
    width: am5.percent(95),
    tooltipY: 0
  });

  series.data.setAll(data);

  // Make stuff animate on load
  // https://www.amcharts.com/docs/v5/concepts/animations/
  series.appear();

  series.bullets.push(function() {
    var label = am5.Label.new(root, {
      text: "{valueY}",
      fill: root.interfaceColors.get("alternativeText"),
      centerY: am5.p50,
      centerX: am5.p50,
      populateText: true,
      textAlign: "center",
      oversizedBehavior: "hide"
    });

    label.adapters.add("text", function(text, target) {
      var val = Math.abs(target.dataItem.get("valueY") - target.dataItem.get("openValueY"));
      return val;
    });

    return am5.Bullet.new(root, {
      locationX: 0.5,
      locationY: 0.5,
      sprite: label
    });
  });

  if (total) {
    series.bullets.push(function() {
      var totalLabel = am5.Label.new(root, {
        text: "{valueY}",
        fill: root.interfaceColors.get("text"),
        centerY: am5.p100,
        centerX: am5.p50,
        populateText: true,
        textAlign: "center"
      });

      totalLabel.adapters.add("text", function(text, target) {
        var dataContext = target.dataItem.dataContext;
        var val = Math.abs(dataContext.close2 - dataContext.open1);
        return val;
      });

      return am5.Bullet.new(root, {
        locationX: 0.5,
        locationY: 1,
        sprite: totalLabel
      });
    });
  }
}

makeSeries("Budget #1", "close1", "open1", false);
makeSeries("Budget #2", "close2", "open2", true);


// Make stuff animate on load
// https://www.amcharts.com/docs/v5/concepts/animations/
chart.appear(1000, 100);

}); // end am5.ready()
</script>

<!-- HTML -->
<div id="chartdiv"></div>