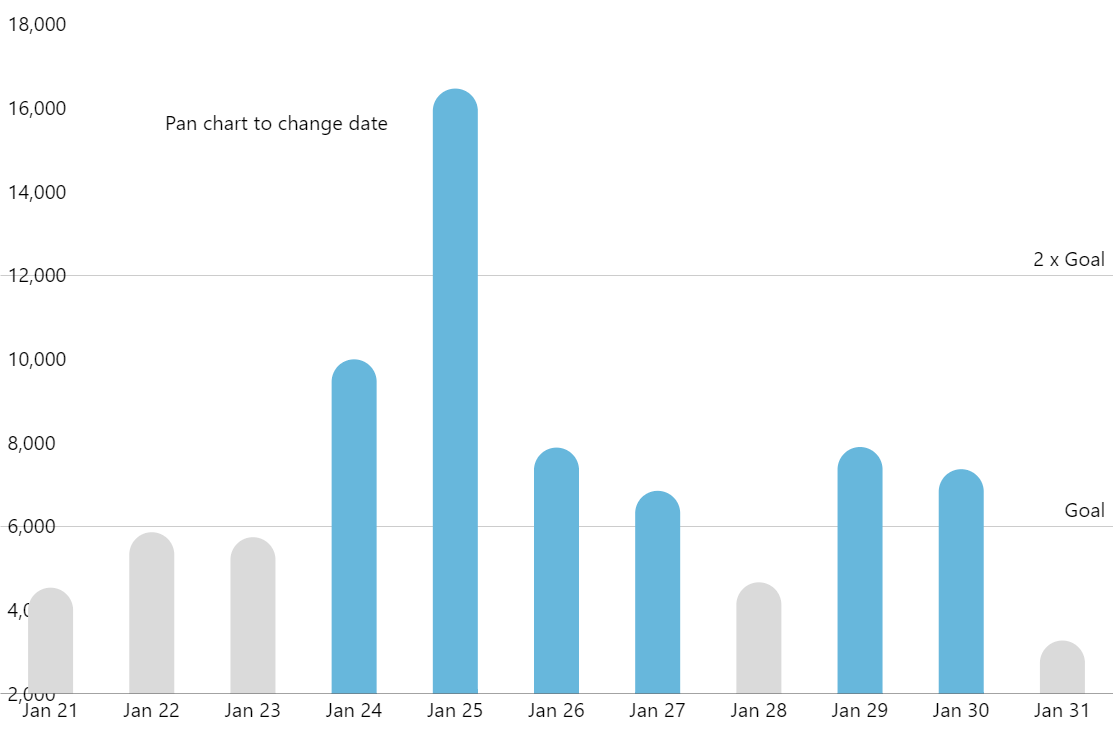
Step Count Chart
This demo is inspired by the chart used in Samsung health app. The cursor always stays in the same position but you can pan the chart to the position you want.
Related tutorials
Demo source
<!-- Styles -->
<style>
#chartdiv {
  width: 100%;
  height: 500px;
}
</style>

<!-- Resources -->
<script src="https://cdn.amcharts.com/lib/5/index.js"></script>
<script src="https://cdn.amcharts.com/lib/5/xy.js"></script>
<script src="https://cdn.amcharts.com/lib/5/themes/Animated.js"></script>

<!-- Chart code -->
<script>
am5.ready(function() {


// Create root element
// https://www.amcharts.com/docs/v5/getting-started/#Root_element
var root = am5.Root.new("chartdiv");

// Set themes
// https://www.amcharts.com/docs/v5/concepts/themes/
root.setThemes([
  am5themes_Animated.new(root)
]);

root.dateFormatter.setAll({
  dateFormat: "yyyy-MM-dd",
  dateFields: ["valueX"]
});

var data = [
  {
    date: "2021-01-01",
    steps: 4561
  },
  {
    date: "2021-01-02",
    steps: 5687
  },
  {
    date: "2021-01-03",
    steps: 6348
  },
  {
    date: "2021-01-04",
    steps: 4878
  },
  {
    date: "2021-01-05",
    steps: 9867
  },
  {
    date: "2021-01-06",
    steps: 7561
  },
  {
    date: "2021-01-07",
    steps: 1287
  },
  {
    date: "2021-01-08",
    steps: 3298
  },
  {
    date: "2021-01-09",
    steps: 5697
  },
  {
    date: "2021-01-10",
    steps: 4878
  },
  {
    date: "2021-01-11",
    steps: 8788
  },
  {
    date: "2021-01-12",
    steps: 9560
  },
  {
    date: "2021-01-13",
    steps: 11687
  },
  {
    date: "2021-01-14",
    steps: 5878
  },
  {
    date: "2021-01-15",
    steps: 9789
  },
  {
    date: "2021-01-16",
    steps: 3987
  },
  {
    date: "2021-01-17",
    steps: 5898
  },
  {
    date: "2021-01-18",
    steps: 9878
  },
  {
    date: "2021-01-19",
    steps: 13687
  },
  {
    date: "2021-01-20",
    steps: 6789
  },
  {
    date: "2021-01-21",
    steps: 4531
  },
  {
    date: "2021-01-22",
    steps: 5856
  },
  {
    date: "2021-01-23",
    steps: 5737
  },
  {
    date: "2021-01-24",
    steps: 9987
  },
  {
    date: "2021-01-25",
    steps: 16457
  },
  {
    date: "2021-01-26",
    steps: 7878
  },
  {
    date: "2021-01-27",
    steps: 6845
  },
  {
    date: "2021-01-28",
    steps: 4659
  },
  {
    date: "2021-01-29",
    steps: 7892
  },
  {
    date: "2021-01-30",
    steps: 7362
  },
  {
    date: "2021-01-31",
    steps: 3268
  }
];

// Create chart
// https://www.amcharts.com/docs/v5/charts/xy-chart/
var chart = root.container.children.push(
  am5xy.XYChart.new(root, {
    focusable: true,
    panX: true,
    panY: false,
    wheelX: "panX",
    wheelY: "none",
    paddingLeft: 0,
    paddingRight: 0
  })
);

var easing = am5.ease.linear;

// hide zoomout button
chart.zoomOutButton.set("forceHidden", true);

// add label
chart.plotContainer.children.push(
  am5.Label.new(root, { text: "Pan chart to change date", x: 100, y: 50 })
);

// Create axes
// https://www.amcharts.com/docs/v5/charts/xy-chart/axes/
var xRenderer = am5xy.AxisRendererX.new(root, {
  minGridDistance: 50,
  strokeOpacity: 0.2,
  minorGridEnabled: true
});
xRenderer.grid.template.set("forceHidden", true);

var xAxis = chart.xAxes.push(
  am5xy.DateAxis.new(root, {
    maxDeviation: 0.49,
    snapTooltip: false,
    baseInterval: {
      timeUnit: "day",
      count: 1
    },
    renderer: xRenderer,
    tooltip: am5.Tooltip.new(root, {})
  })
);

var yRenderer = am5xy.AxisRendererY.new(root, { inside: true });
yRenderer.grid.template.set("forceHidden", true);

var yAxis = chart.yAxes.push(
  am5xy.ValueAxis.new(root, {
    maxDeviation: 0,
    renderer: yRenderer
  })
);

// Add series
// https://www.amcharts.com/docs/v5/charts/xy-chart/series/
var series = chart.series.push(
  am5xy.ColumnSeries.new(root, {
    xAxis: xAxis,
    yAxis: yAxis,
    valueYField: "steps",
    valueXField: "date",
    tooltip: am5.Tooltip.new(root, {
      pointerOrientation: "vertical",
      labelText: "{valueY}"
    })
  })
);

series.columns.template.setAll({
  cornerRadiusTL: 15,
  cornerRadiusTR: 15,
  maxWidth: 30,
  strokeOpacity: 0
});

series.columns.template.adapters.add("fill", function (fill, target) {
  if (target.dataItem.get("valueY") < 6000) {
    return am5.color(0xdadada);
  }
  return fill;
});

// Set up data processor to parse string dates
// https://www.amcharts.com/docs/v5/concepts/data/#Pre_processing_data
series.data.processor = am5.DataProcessor.new(root, {
  dateFormat: "yyyy-MM-dd",
  dateFields: ["date"]
});

series.data.setAll(data);

// do not allow tooltip  to move horizontally
series.get("tooltip").adapters.add("x", function (x) {
  return chart.plotContainer.toGlobal({
    x: chart.plotContainer.width() / 2,
    y: 0
  }).x;
});

// add ranges
var goalRange = yAxis.createAxisRange(yAxis.makeDataItem({
  value: 6000
}));

goalRange.get("grid").setAll({
  forceHidden: false,
  strokeOpacity: 0.2
});

var goalLabel = goalRange.get("label");

goalLabel.setAll({
  centerY: am5.p100,
  centerX: am5.p100,
  text: "Goal"
});

// put to other side
goalLabel.adapters.add("x", function (x) {
  return chart.plotContainer.width();
});

var goalRange2 = yAxis.createAxisRange(yAxis.makeDataItem({
  value: 12000
}));

goalRange2.get("grid").setAll({
  forceHidden: false,
  strokeOpacity: 0.2
});

var goalLabel2 = goalRange2.get("label");

goalLabel2.setAll({
  centerY: am5.p100,
  centerX: am5.p100,
  text: "2 x Goal"
});

// put to other side
goalLabel2.adapters.add("x", function (x) {
  return chart.plotContainer.width();
});

// reposition when width changes
chart.plotContainer.onPrivate("width", function () {
  goalLabel.markDirtyPosition();
  goalLabel2.markDirtyPosition();
});

// Add cursor
// https://www.amcharts.com/docs/v5/charts/xy-chart/cursor/
var cursor = chart.set("cursor", am5xy.XYCursor.new(root, {
  alwaysShow: true,
  behavior: "none",
  positionX: 0.5 // make it always be at the center
}));
cursor.lineY.set("visible", false);

// zoom to last 11 days
series.events.on("datavalidated", function () {
  var toTime =
    series.dataItems[series.dataItems.length - 1].get("valueX") +
    am5.time.getDuration("day", 1);
  var fromTime = series.dataItems[series.dataItems.length - 11].get("valueX");

  xAxis.zoomToValues(fromTime, toTime);
});

// when plot are is released, round zoom to nearest days
chart.plotContainer.events.on("globalpointerup", function () {
  var dayDuration = am5.time.getDuration("day", 1);

  var firstTime = am5.time
    .round(new Date(series.dataItems[0].get("valueX")), "day", 1)
    .getTime();
  var lastTime =
    series.dataItems[series.dataItems.length - 1].get("valueX") + dayDuration;
  var totalTime = lastTime - firstTime;
  var days = totalTime / dayDuration;

  var roundedStart =
    firstTime + Math.round(days * xAxis.get("start")) * dayDuration;
  var roundedEnd =
    firstTime + Math.round(days * xAxis.get("end")) * dayDuration;

  xAxis.zoomToValues(roundedStart, roundedEnd);
});

// Make stuff animate on load
// https://www.amcharts.com/docs/v5/concepts/animations/
chart.appear(1000, 50);

}); // end am5.ready()
</script>

<!-- HTML -->
<div id="chartdiv"></div>