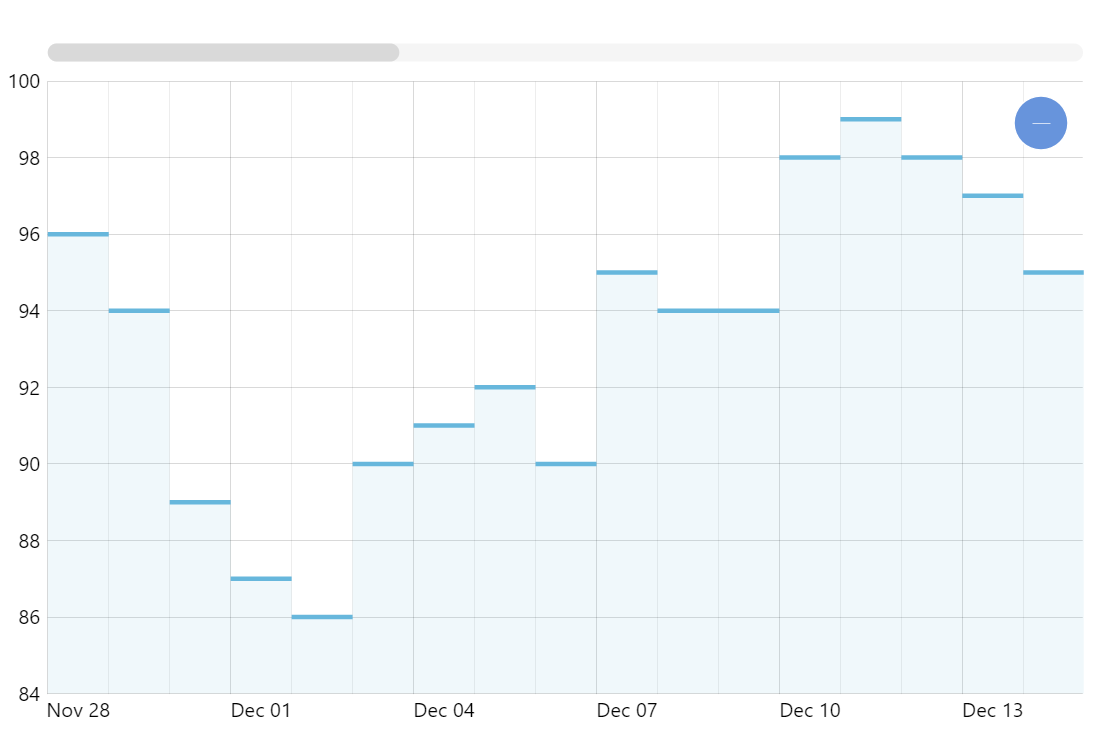
Step Line Without Risers
Step line chart is a great alternative to a regular line chart when you have discreet data items. A regular line connecting two data points would mislead the viewer suggesting that there was some continuous movement from point A to point B when in reality there was a jump with no intermediary values. Additionally, amCharts lets you display step line chart with no vertical lines making it a great alternative to a column chart when there’s a lot of data.
Key implementation details
We use StepLineSeries to display a step line chart in amCharts XY Chart. Removing vertical risers is as easy as setting noRisers = true on the series.
Related tutorials
Demo source
<!-- Styles -->
<style>
#chartdiv {
  width: 100%;
  height: 500px;
}
</style>

<!-- Resources -->
<script src="https://cdn.amcharts.com/lib/5/index.js"></script>
<script src="https://cdn.amcharts.com/lib/5/xy.js"></script>
<script src="https://cdn.amcharts.com/lib/5/themes/Animated.js"></script>

<!-- Chart code -->
<script>
am5.ready(function() {

// Create root element
// https://www.amcharts.com/docs/v5/getting-started/#Root_element
var root = am5.Root.new("chartdiv");


// Set themes
// https://www.amcharts.com/docs/v5/concepts/themes/
root.setThemes([
  am5themes_Animated.new(root)
]);


// Create chart
// https://www.amcharts.com/docs/v5/charts/xy-chart/
var chart = root.container.children.push(am5xy.XYChart.new(root, {
  panX: true,
  panY: true,
  wheelX: "panX",
  wheelY: "zoomX",
  pinchZoomX: true,
  paddingLeft: 0
}));


// Add cursor
// https://www.amcharts.com/docs/v5/charts/xy-chart/cursor/
var cursor = chart.set("cursor", am5xy.XYCursor.new(root, {}));
cursor.lineY.set("visible", false);


// Generate random data
var date = new Date();
date.setHours(0, 0, 0, 0);
var value = 100;

function generateData() {
  value = Math.round((Math.random() * 10 - 5) + value);

  if (value < 10) {
    value = 10;
  }

  am5.time.add(date, "day", 1);
  return { date: date.getTime(), value: value };
}

function generateDatas(count) {
  var data = [];
  for (var i = 0; i < count; ++i) {
    data.push(generateData());
  }
  return data;
}


// Create axes
// https://www.amcharts.com/docs/v5/charts/xy-chart/axes/
var xAxis = chart.xAxes.push(am5xy.DateAxis.new(root, {
  baseInterval: { timeUnit: "day", count: 1 },
  renderer: am5xy.AxisRendererX.new(root, {
    pan: "zoom",
    minorGridEnabled: true,
    minGridDistance: 80
  }),
  tooltip: am5.Tooltip.new(root, {})
}));

var yAxis = chart.yAxes.push(am5xy.ValueAxis.new(root, {
  renderer: am5xy.AxisRendererY.new(root, {
    pan: "zoom"
  })
}));

// Add series
// https://www.amcharts.com/docs/v5/charts/xy-chart/series/
var series = chart.series.push(am5xy.StepLineSeries.new(root, {
  name: "Series",
  xAxis: xAxis,
  yAxis: yAxis,
  valueYField: "value",
  valueXField: "date",
  noRisers: true,
  tooltip: am5.Tooltip.new(root, {
    labelText: "{valueY}"
  })
}));

series.strokes.template.setAll({
  strokeWidth: 3
});

series.fills.template.setAll({
  fillOpacity: 0.1,
  visible: true
});


// Add scrollbar
// https://www.amcharts.com/docs/v5/charts/xy-chart/scrollbars/
chart.set("scrollbarX", am5.Scrollbar.new(root, {
  orientation: "horizontal"
}));

var data = generateDatas(50);
series.data.setAll(data);

// Make stuff animate on load
// https://www.amcharts.com/docs/v5/concepts/animations/
series.appear(1000);
chart.appear(1000, 100);

}); // end am5.ready()
</script>

<!-- HTML -->
<div id="chartdiv"></div>