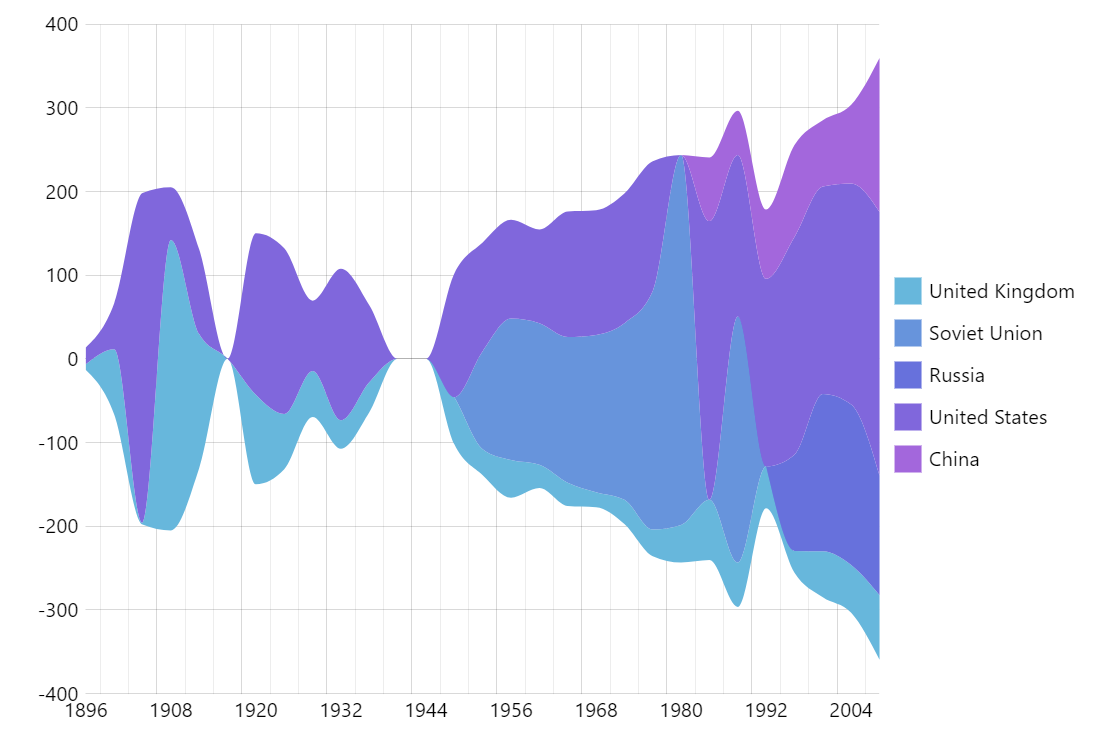
Stream / ThemeRiver Chart
The ThemeRiver or Stream chart is a type of flow graph that shows changes of events (themes) over time.
Key implementation details
We use SmoothedXLinesSeries for the series. We set fillOpacity on it to 1 to make it an area chart. Then we process the data to create valueYField and openValueYField data fields holding ajdusted values for the stacking effect.
Related tutorials
Demo source
<!-- Styles -->
<style>
#chartdiv {
  width: 100%;
  height: 500px;
}
</style>

<!-- Resources -->
<script src="https://cdn.amcharts.com/lib/5/index.js"></script>
<script src="https://cdn.amcharts.com/lib/5/xy.js"></script>
<script src="https://cdn.amcharts.com/lib/5/themes/Animated.js"></script>

<!-- Chart code -->
<script>
am5.ready(function() {

// Create root element
// https://www.amcharts.com/docs/v5/getting-started/#Root_element
var root = am5.Root.new("chartdiv");


// Set themes
// https://www.amcharts.com/docs/v5/concepts/themes/
root.setThemes([
  am5themes_Animated.new(root)
]);


// Create chart
// https://www.amcharts.com/docs/v5/charts/xy-chart/
var chart = root.container.children.push(am5xy.XYChart.new(root, {
  panX: false,
  panY: false,
  wheelX: "panX",
  wheelY: "zoomX",
  layout: root.horizontalLayout
}));


// Add legend
// https://www.amcharts.com/docs/v5/charts/xy-chart/legend-xy-series/
var legend = chart.children.push(
  am5.Legend.new(root, {
    centerY: am5.p50,
    y: am5.p50,
    layout: root.verticalLayout,
    clickTarget: "none"
  })
);

legend.valueLabels.template.set("forceHidden", true);


// Data
var data = [
	{ year: "1896", uk: 7, ussr: 0, russia: 0, usa: 20, china: 0 },
	{ year: "1900", uk: 78, ussr: 0, russia: 0, usa: 55, china: 0 },
	{ year: "1904", uk: 2, ussr: 0, russia: 0, usa: 394, china: 0 },
	{ year: "1908", uk: 347, ussr: 0, russia: 0, usa: 63, china: 0 },
	{ year: "1912", uk: 160, ussr: 0, russia: 0, usa: 101, china: 0 },
	{ year: "1916", uk: 0, ussr: 0, russia: 0, usa: 0, china: 0 },
	{ year: "1920", uk: 107, ussr: 0, russia: 0, usa: 193, china: 0 },
	{ year: "1924", uk: 66, ussr: 0, russia: 0, usa: 198, china: 0 },
	{ year: "1928", uk: 55, ussr: 0, russia: 0, usa: 84, china: 0 },
	{ year: "1932", uk: 34, ussr: 0, russia: 0, usa: 181, china: 0 },
	{ year: "1936", uk: 36, ussr: 0, russia: 0, usa: 92, china: 0 },
	{ year: "1940", uk: 0, ussr: 0, russia: 0, usa: 0, china: 0 },
	{ year: "1944", uk: 0, ussr: 0, russia: 0, usa: 0, china: 0 },
	{ year: "1948", uk: 56, ussr: 0, russia: 0, usa: 148, china: 0 },
	{ year: "1952", uk: 31, ussr: 117, russia: 0, usa: 130, china: 0 },
	{ year: "1956", uk: 45, ussr: 169, russia: 0, usa: 118, china: 0 },
	{ year: "1960", uk: 28, ussr: 169, russia: 0, usa: 112, china: 0 },
	{ year: "1964", uk: 28, ussr: 174, russia: 0, usa: 150, china: 0 },
	{ year: "1968", uk: 18, ussr: 188, russia: 0, usa: 149, china: 0 },
	{ year: "1972", uk: 29, ussr: 211, russia: 0, usa: 155, china: 0 },
	{ year: "1976", uk: 32, ussr: 285, russia: 0, usa: 155, china: 0 },
	{ year: "1980", uk: 45, ussr: 442, russia: 0, usa: 0, china: 0 },
	{ year: "1984", uk: 72, ussr: 0, russia: 0, usa: 333, china: 76 },
	{ year: "1988", uk: 53, ussr: 294, russia: 0, usa: 193, china: 53 },
	{ year: "1992", uk: 50, ussr: 0, russia: 0, usa: 224, china: 83 },
	{ year: "1996", uk: 26, ussr: 0, russia: 115, usa: 260, china: 110 },
	{ year: "2000", uk: 55, ussr: 0, russia: 188, usa: 248, china: 79 },
	{ year: "2004", uk: 57, ussr: 0, russia: 192, usa: 264, china: 94 },
	{ year: "2008", uk: 77, ussr: 0, russia: 143, usa: 315, china: 184 }
];


// Create axes
// https://www.amcharts.com/docs/v5/charts/xy-chart/axes/
var xAxis = chart.xAxes.push(am5xy.CategoryAxis.new(root, {
  categoryField: "year",
  startLocation: 0.5,
  endLocation: 0.5,
  renderer: am5xy.AxisRendererX.new(root, {
    pan: "zoom",
    minorGridEnabled: true,
    minGridDistance: 50
  }),
  tooltip: am5.Tooltip.new(root, {})
}));

xAxis.data.setAll(data);

var yAxis = chart.yAxes.push(am5xy.ValueAxis.new(root, {
  renderer: am5xy.AxisRendererY.new(root, {
    pan: "zoom"
  })
}));


// Add series
// https://www.amcharts.com/docs/v5/charts/xy-chart/series/
function createSeries(field, name) {
  var series = chart.series.push(am5xy.SmoothedXLineSeries.new(root, {
    name: name,
    xAxis: xAxis,
    yAxis: yAxis,
    valueField: field,
    valueYField: field + "_hi",
    openValueYField: field + "_low",
    categoryXField: "year",
    tooltip: am5.Tooltip.new(root, {
      pointerOrientation: "horizontal",
      labelText: "[fontSize: 18px]{name}[/]\n{categoryX}: [bold]{" + field + "}[/]"
    })
  }));

  // Do not show tooltip for zero values
  series.get("tooltip").adapters.add("visible", function(visible, target) {
    if (target.dataItem && (target.dataItem.get("value") > 0)) {
      return true;
    }
    return false;
  });

  series.strokes.template.setAll({
    forceHidden: true
  });

  series.fills.template.setAll({
    visible: true,
    fillOpacity: 1
  });


  // Make stuff animate on load
  // https://www.amcharts.com/docs/v5/concepts/animations/
  series.appear();

  legend.data.push(series);
}

createSeries("uk", "United Kingdom");
createSeries("ussr", "Soviet Union");
createSeries("russia", "Russia");
createSeries("usa", "United States");
createSeries("china", "China");

// Prepare data for the river-stacked series
for (var i = 0; i < data.length; i++) {
  var row = data[i];
  var sum = 0;

  // Calculate open and close values
  chart.series.each(function(series) {
    var field = series.get("valueField");
    var val = Number(row[field]);
    row[field + "_low"] = sum;
    row[field + "_hi"] = sum + val;
    sum += val;
  });

  // Adjust values so they are centered
  var offset = sum / 2;
  chart.series.each(function(series) {
    var field = series.get("valueField");
    row[field + "_low"] -= offset;
    row[field + "_hi"] -= offset;
  });

  chart.series.each(function(series) {
    var field = series.get("valueField");
    series.data.setAll(data);
  });

}


// Add cursor
chart.set("cursor", am5xy.XYCursor.new(root, {
  behavior: "zoomXY",
  xAxis: xAxis
}));


// Make stuff animate on load
// https://www.amcharts.com/docs/v5/concepts/animations/
chart.appear(1000, 100);

}); // end am5.ready()
</script>

<!-- HTML -->
<div id="chartdiv"></div>