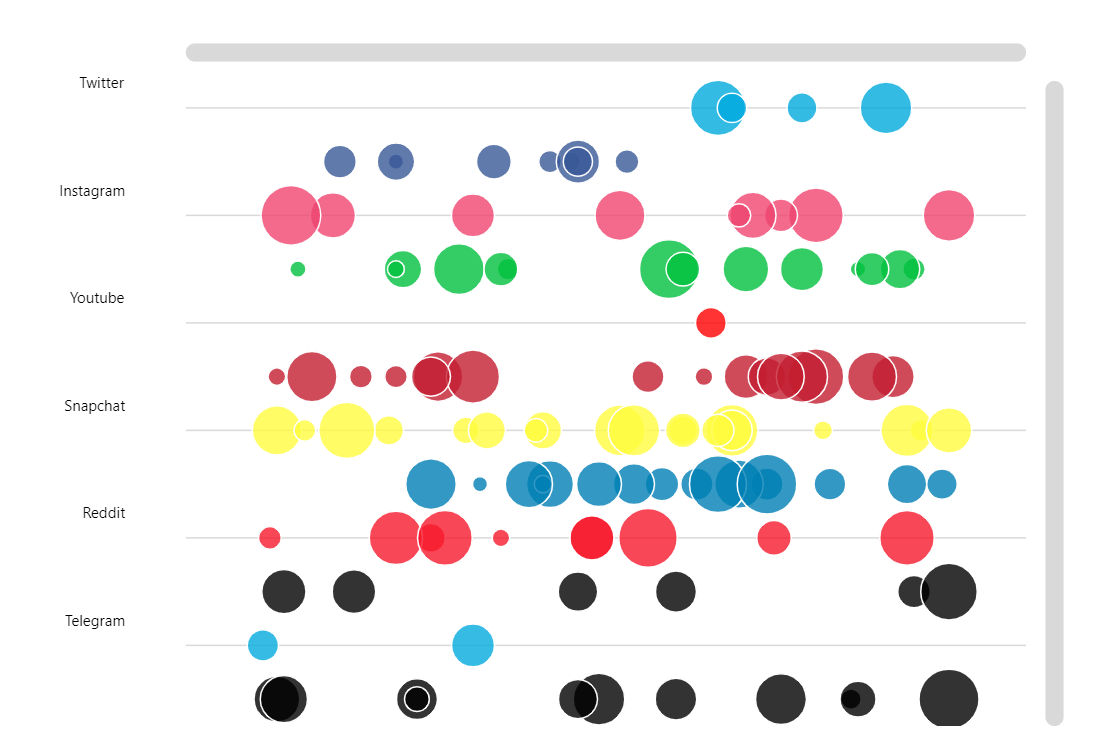
Strip Plot
A strip plot displays a distribution of many values across some categories.
Key implementation details
In this demo we use LineSeries to create a line chart (with CategoryAxis on the left) with an invisible line (strokeOpacity: 0) and use its bullets to display our data points. We apply heat rules to the bullets to set the circles’ radii based on the data items value.
Related tutorials
Demo source
<!-- Styles -->
<style>
#chartdiv {
  width: 100%;
  height: 550px;
}
</style>

<!-- Resources -->
<script src="https://cdn.amcharts.com/lib/5/index.js"></script>
<script src="https://cdn.amcharts.com/lib/5/xy.js"></script>
<script src="https://cdn.amcharts.com/lib/5/themes/Animated.js"></script>

<!-- Chart code -->
<script>
am5.ready(function() {

/**
 * ---------------------------------------
 * This demo was created using amCharts 5.
 *
 * For more information visit:
 * https://www.amcharts.com/
 *
 * Documentation is available at:
 * https://www.amcharts.com/docs/v5/
 * ---------------------------------------
 */

// Create root element
// https://www.amcharts.com/docs/v5/getting-started/#Root_element
var root = am5.Root.new("chartdiv");


// Set themes
// https://www.amcharts.com/docs/v5/concepts/themes/
root.setThemes([
  am5themes_Animated.new(root)
]);


// Create chart
// https://www.amcharts.com/docs/v5/charts/xy-chart/
var chart = root.container.children.push(am5xy.XYChart.new(root, {
  panX: false,
  panY: false,
  wheelX: "panX",
  wheelY: "zoomX",
  layout: root.verticalLayout
}));

var categories = [{
  category: "Twitter",
  icon: "https://assets.codepen.io/t-160/icon_social_twitter.svg",
  color: am5.color(0x00aade)
}, {
  category: "Facebook",
  icon: "https://assets.codepen.io/t-160/icon_social_facebook.svg",
  color: am5.color(0x385997)
}, {
  category: "Instagram",
  icon: "https://assets.codepen.io/t-160/icon_social_instagram.svg",
  color: am5.color(0xf04571)
}, {
  category: "WhatsApp",
  icon: "https://assets.codepen.io/t-160/icon_social_whatsapp.svg",
  color: am5.color(0x03c03e)
}, {
  category: "Youtube",
  icon: "https://assets.codepen.io/t-160/icon_social_youtube.svg",
  color: am5.color(0xff0100)
}, {
  category: "Pinterest",
  icon: "https://assets.codepen.io/t-160/icon_social_pinterest.svg",
  color: am5.color(0xc31e31)
}, {
  category: "Snapchat",
  icon: "https://assets.codepen.io/t-160/icon_social_snapchat.svg",
  color: am5.color(0xfffc40)
}, {
  category: "LinkedIn",
  icon: "https://assets.codepen.io/t-160/icon_social_linkedin.svg",
  color: am5.color(0x007fb5)
}, {
  category: "Reddit",
  icon: "https://assets.codepen.io/t-160/icon_social_reddit.svg",
  color: am5.color(0xf7192d)
}, {
  category: "Digg",
  icon: "https://assets.codepen.io/t-160/icon_social_digg.svg",
  color: am5.color(0x000000)
}, {
  category: "Telegram",
  icon: "https://assets.codepen.io/t-160/icon_social_telegram.svg",
  color: am5.color(0x04acde)
}, {
  category: "Vine",
  icon: "https://assets.codepen.io/t-160/icon_social_vine.svg",
  color: am5.color(0x000000)
}];


// Create axes
// https://www.amcharts.com/docs/v5/charts/xy-chart/axes/
var yAxis = chart.yAxes.push(am5xy.CategoryAxis.new(root, {
  categoryField: "category",
  renderer: am5xy.AxisRendererY.new(root, {
    cellStartLocation: 0.1,
    cellEndLocation: 0.9,
    inversed: true
  }),
  bullet: function (root, axis, dataItem) {
    return am5xy.AxisBullet.new(root, {
      locationY: 0.5,
      sprite: am5.Picture.new(root, {
        dx: -10,
        width: 24,
        height: 24,
        centerY: am5.p50,
        centerX: am5.p100,
        src: dataItem.dataContext.icon
      })
    });
  }
}));

var yRenderer = yAxis.get("renderer");

yRenderer.labels.template.setAll({
  paddingRight: 40
});

yRenderer.grid.template.setAll({
  location: 0.5
});

yAxis.data.setAll(categories);

var xAxis = chart.xAxes.push(am5xy.ValueAxis.new(root, {
  min: -10,
  max: 110,
  strictMinMax: true,
  renderer: am5xy.AxisRendererX.new(root, {})
}));

var xRenderer = xAxis.get("renderer");

xRenderer.labels.template.setAll({
  forceHidden: true
});

xRenderer.grid.template.setAll({
  forceHidden: true
});

// Data
var data = [];

for(var i = 0; i < categories.length; i++) {
  var category = categories[i];
  var count = Math.ceil(Math.random() * 20);
  for(var x = 0; x < count; x++) {
    data.push({
      category: category.category,
      position: Math.round(Math.random() * 100),
      value: Math.round(Math.random() * 1000),
      bulletSettings: {
        fill: category.color
      }
    })
  }
}


// Add series
// https://www.amcharts.com/docs/v5/charts/xy-chart/series/
var series = chart.series.push(am5xy.LineSeries.new(root, {
  xAxis: xAxis,
  yAxis: yAxis,
  baseAxis: yAxis,
  valueXField: "position",
  valueField: "value",
  categoryYField: "category",
  calculateAggregates: true
}));

series.strokes.template.setAll({
  strokeOpacity: 0
});

series.data.setAll(data);

// Add bullets
var circleTemplate = am5.Template.new({});

var bullet = series.bullets.push(function () {
  return am5.Bullet.new(root, {
    locationY: 0.5,
    sprite: am5.Circle.new(root, {
      tooltipText: "{valueX}: [bold]{value}[/]",
      radius: 5,
      stroke: am5.color(0xffffff),
      strokeWidth: 1,
      fillOpacity: 0.8,
      templateField: "bulletSettings"
    }, circleTemplate)
  });
});

// Add heat rules to bullets
series.set("heatRules", [{
  target: circleTemplate,
  min: 5,
  max: 20,
  dataField: "value",
  key: "radius"
}]);

// Scrollbars
chart.set("scrollbarX", am5.Scrollbar.new(root, { orientation: "horizontal" }));
chart.set("scrollbarY", am5.Scrollbar.new(root, { orientation: "vertical" }));

// Make stuff animate on load
// https://www.amcharts.com/docs/v5/concepts/animations/
series.appear();
chart.appear(1000, 100);

}); // end am5.ready()
</script>

<!-- HTML -->
<div id="chartdiv"></div>