Tree Chart
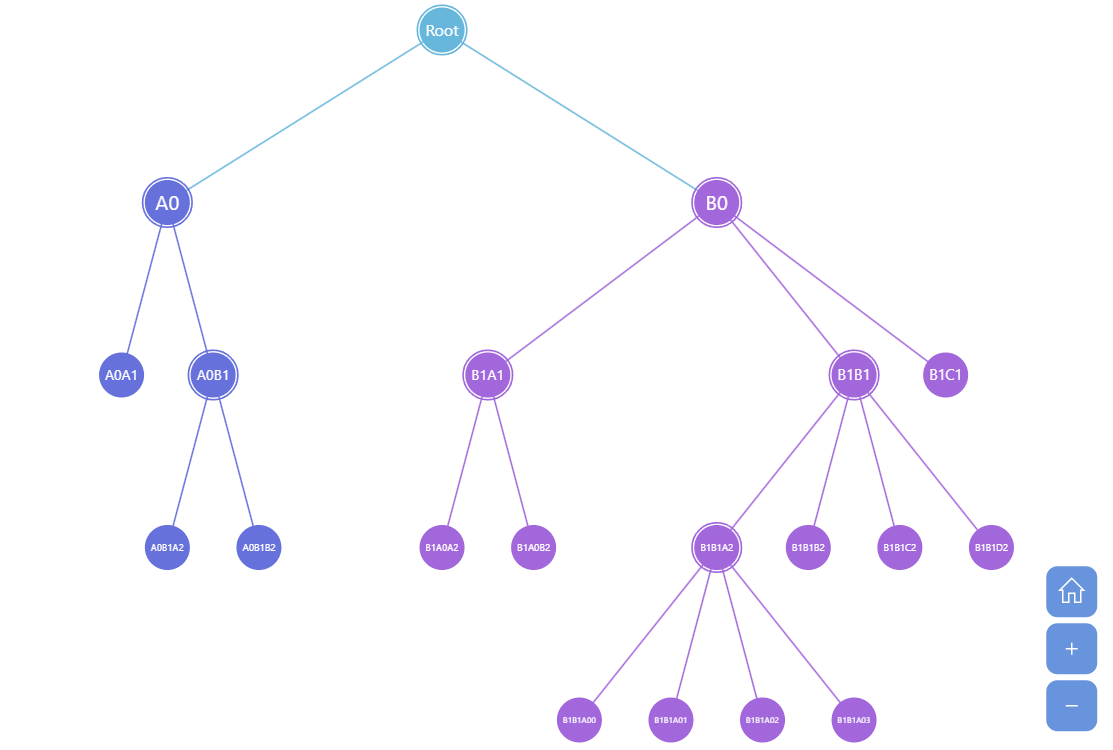
Tree Chart is the simplest form of a hierarchy chart, conceptually speaking. It displays child nodes under the parent nodes with same-level children placed on the same level visually. amCharts Tree Chart enables collapsing of the branches (try clicking on a node with children) and auto-calculation of values based on the children values.
Key implementation details
Tree chart is a part of amCharts hierarchy module. Like with other hierarchy charts we create a Container and then push a new Tree object into it. All that’s left is to specify categoryField, valueField, and childDataField for the tree.
This chart is added to a Zoomable Container, so you can pan, zoom-in and zoom-out this chart using mouse wheel, pinch-zoom or zoom tools on the bottom-right.
Related tutorials
Demo source
<!-- Styles -->
<style>
#chartdiv {
  width: 100%;
  height: 550px;
}
</style>

<!-- Resources -->
<script src="https://cdn.amcharts.com/lib/5/index.js"></script>
<script src="https://cdn.amcharts.com/lib/5/hierarchy.js"></script>
<script src="https://cdn.amcharts.com/lib/5/themes/Animated.js"></script>

<!-- Chart code -->
<script>
am5.ready(function() {


// Create root element
// https://www.amcharts.com/docs/v5/getting-started/#Root_element
var root = am5.Root.new("chartdiv");


// Set themes
// https://www.amcharts.com/docs/v5/concepts/themes/
root.setThemes([
  am5themes_Animated.new(root)
]);


var zoomableContainer = root.container.children.push(
  am5.ZoomableContainer.new(root, {
    width: am5.p100,
    height: am5.p100,
    wheelable: true,
    pinchZoom: true
  })
);

var zoomTools = zoomableContainer.children.push(am5.ZoomTools.new(root, {
  target: zoomableContainer
}));

// Create series
// https://www.amcharts.com/docs/v5/charts/hierarchy/#Adding
var series = zoomableContainer.contents.children.push(am5hierarchy.Tree.new(root, {
  singleBranchOnly: false,
  downDepth: 1,
  initialDepth: 10,
  valueField: "value",
  categoryField: "name",
  childDataField: "children"
}));

series.labels.template.set("minScale", 0);

// Generate and set data
// https://www.amcharts.com/docs/v5/charts/hierarchy/#Setting_data
var maxLevels = 3;
var maxNodes = 3;
var maxValue = 100;

var data = {
  name: "Root",
  children: []
}
generateLevel(data, "", 0);

series.data.setAll([data]);
series.set("selectedDataItem", series.dataItems[0]);

function generateLevel(data, name, level) {
  for (var i = 0; i < Math.ceil(maxNodes * Math.random()) + 1; i++) {
    var nodeName = name + "ABCDEFGHIJKLMNOPQRSTUVWXYZ"[i];
    var child;
    if (level < maxLevels) {
      child = {
        name: nodeName + level
      }

      if (level > 0 && Math.random() < 0.5) {
        child.value = Math.round(Math.random() * maxValue);
      }
      else {
        child.children = [];
        generateLevel(child, nodeName + i, level + 1)
      }
    }
    else {
      child = {
        name: name + i,
        value: Math.round(Math.random() * maxValue)
      }
    }
    data.children.push(child);
  }

  level++;
  return data;
}


// Make stuff animate on load
series.appear(1000, 100);

}); // end am5.ready()
</script>

<!-- HTML -->
<div id="chartdiv"></div>