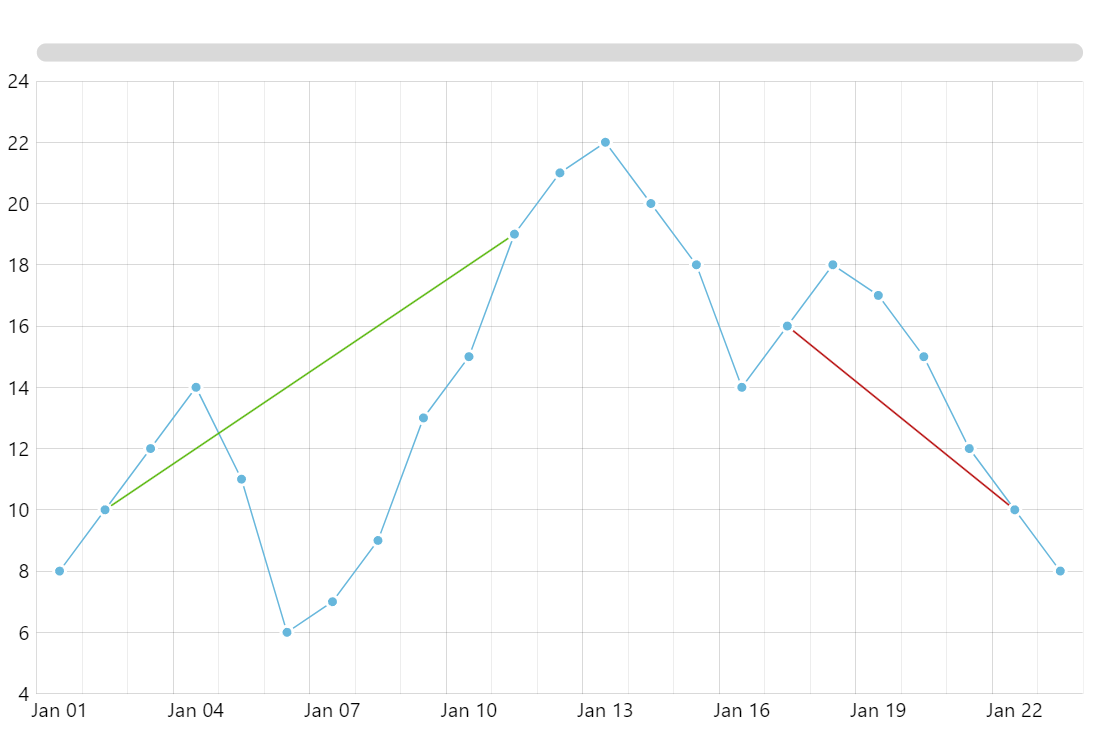
Trend Lines
You can create real analytical trendlines, indicators, and other annotations with amCharts Stock Chart but when you need something simple you can just use the core tools at your disposal in the XY Charts.
Key implementation details
To imitate trendlines we simple add extra line series with just two data points at the ends of the line.
Related tutorials
Demo source
<!-- Styles -->
<style>
#chartdiv {
  width: 100%;
  height: 500px;
}
</style>

<!-- Resources -->
<script src="https://cdn.amcharts.com/lib/5/index.js"></script>
<script src="https://cdn.amcharts.com/lib/5/xy.js"></script>
<script src="https://cdn.amcharts.com/lib/5/themes/Animated.js"></script>

<!-- Chart code -->
<script>
am5.ready(function() {

// Create root element
// https://www.amcharts.com/docs/v5/getting-started/#Root_element
var root = am5.Root.new("chartdiv");

// Set themes
// https://www.amcharts.com/docs/v5/concepts/themes/
root.setThemes([
  am5themes_Animated.new(root)
]);

root.dateFormatter.setAll({
  dateFormat: "yyyy",
  dateFields: ["valueX"]
});

var data = [
  {
    date: "2012-01-01",
    value: 8
  },
  {
    date: "2012-01-02",
    value: 10
  },
  {
    date: "2012-01-03",
    value: 12
  },
  {
    date: "2012-01-04",
    value: 14
  },
  {
    date: "2012-01-05",
    value: 11
  },
  {
    date: "2012-01-06",
    value: 6
  },
  {
    date: "2012-01-07",
    value: 7
  },
  {
    date: "2012-01-08",
    value: 9
  },
  {
    date: "2012-01-09",
    value: 13
  },
  {
    date: "2012-01-10",
    value: 15
  },
  {
    date: "2012-01-11",
    value: 19
  },
  {
    date: "2012-01-12",
    value: 21
  },
  {
    date: "2012-01-13",
    value: 22
  },
  {
    date: "2012-01-14",
    value: 20
  },
  {
    date: "2012-01-15",
    value: 18
  },
  {
    date: "2012-01-16",
    value: 14
  },
  {
    date: "2012-01-17",
    value: 16
  },
  {
    date: "2012-01-18",
    value: 18
  },
  {
    date: "2012-01-19",
    value: 17
  },
  {
    date: "2012-01-20",
    value: 15
  },
  {
    date: "2012-01-21",
    value: 12
  },
  {
    date: "2012-01-22",
    value: 10
  },
  {
    date: "2012-01-23",
    value: 8
  }
];

// Create chart
// https://www.amcharts.com/docs/v5/charts/xy-chart/
var chart = root.container.children.push(
  am5xy.XYChart.new(root, {
    focusable: true,
    panX: true,
    panY: true,
    wheelX: "panX",
    wheelY: "zoomX",
    pinchZoomX: true,
    paddingLeft: 0
  })
);

var easing = am5.ease.linear;

// Create axes
// https://www.amcharts.com/docs/v5/charts/xy-chart/axes/
var xAxis = chart.xAxes.push(
  am5xy.DateAxis.new(root, {
    maxDeviation: 0.5,
    groupData: false,
    baseInterval: {
      timeUnit: "day",
      count: 1
    },
    renderer: am5xy.AxisRendererX.new(root, {
      pan: "zoom",
      minGridDistance: 70,
      minorGridEnabled: true
    }),
    tooltip: am5.Tooltip.new(root, {})
  })
);

var yAxis = chart.yAxes.push(
  am5xy.ValueAxis.new(root, {
    maxDeviation: 1,
    renderer: am5xy.AxisRendererY.new(root, { pan: "zoom" })
  })
);

// Add series
// https://www.amcharts.com/docs/v5/charts/xy-chart/series/
var series = chart.series.push(
  am5xy.LineSeries.new(root, {
    minBulletDistance: 10,
    xAxis: xAxis,
    yAxis: yAxis,
    valueYField: "value",
    valueXField: "date",
    tooltip: am5.Tooltip.new(root, {
      pointerOrientation: "horizontal",
      labelText: "{valueY}"
    })
  })
);

// Set up data processor to parse string dates
// https://www.amcharts.com/docs/v5/concepts/data/#Pre_processing_data
series.data.processor = am5.DataProcessor.new(root, {
  dateFormat: "yyyy-MM-dd",
  dateFields: ["date"]
});

series.data.setAll(data);

series.bullets.push(function () {
  var circle = am5.Circle.new(root, {
    radius: 4,
    fill: series.get("fill"),
    stroke: root.interfaceColors.get("background"),
    strokeWidth: 2
  });

  return am5.Bullet.new(root, {
    sprite: circle
  });
});

createTrendLine(
  [
    { date: "2012-01-02", value: 10 },
    { date: "2012-01-11", value: 19 }
  ],
  root.interfaceColors.get("positive")
);

createTrendLine(
  [
    { date: "2012-01-17", value: 16 },
    { date: "2012-01-22", value: 10 }
  ],
  root.interfaceColors.get("negative")
);

function createTrendLine(data, color) {
  var series = chart.series.push(
    am5xy.LineSeries.new(root, {
      xAxis: xAxis,
      yAxis: yAxis,
      valueXField: "date",
      stroke: color,
      valueYField: "value"
    })
  );

  series.data.processor = am5.DataProcessor.new(root, {
    dateFormat: "yyyy-MM-dd",
    dateFields: ["date"]
  });

  series.data.setAll(data);
  series.appear(1000, 100);
}

// Add cursor
// https://www.amcharts.com/docs/v5/charts/xy-chart/cursor/
var cursor = chart.set("cursor", am5xy.XYCursor.new(root, {
  xAxis: xAxis
}));
cursor.lineY.set("visible", false);

// add scrollbar
chart.set("scrollbarX", am5.Scrollbar.new(root, {
  orientation: "horizontal"
}));

// Make stuff animate on load
// https://www.amcharts.com/docs/v5/concepts/animations/
series.appear(1000, 100);
chart.appear(1000, 100);

}); // end am5.ready()
</script>

<!-- HTML -->
<div id="chartdiv"></div>