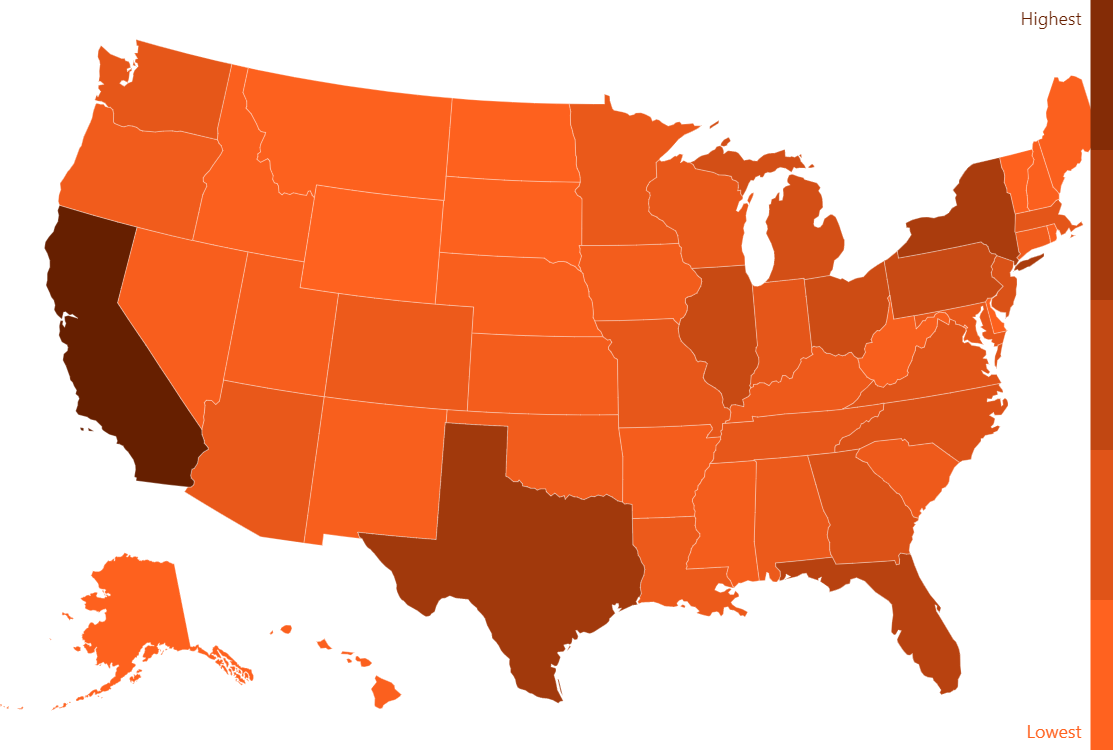
US Heat (Choropleth) Map
Using our mapping tool you can easily create heat (or as BI-centric folks like to call it, choropleth) maps. You only need to set light and dark color, and if your areas/countries/states has value assigned, the map will automatically choose intermediate color corresponding its value.
Related tutorials
Demo source
<!-- Styles -->
<style>
#chartdiv {
  width: 100%;
  height: 500px
}
</style>

<!-- Resources -->
<script src="https://cdn.amcharts.com/lib/5/index.js"></script>
<script src="https://cdn.amcharts.com/lib/5/map.js"></script>
<script src="https://cdn.amcharts.com/lib/5/geodata/usaLow.js"></script>
<script src="https://cdn.amcharts.com/lib/5/themes/Animated.js"></script>

<!-- Chart code -->
<script>
am5.ready(function() {

// Create root
var root = am5.Root.new("chartdiv");

// Set themes
root.setThemes([
  am5themes_Animated.new(root)
]);

// Create chart
var chart = root.container.children.push(am5map.MapChart.new(root, {
  panX: "rotateX",
  panY: "none",
  projection: am5map.geoAlbersUsa(),
  layout: root.horizontalLayout
}));

// Create polygon series
var polygonSeries = chart.series.push(am5map.MapPolygonSeries.new(root, {
  geoJSON: am5geodata_usaLow,
  valueField: "value",
  calculateAggregates: true
}));

polygonSeries.mapPolygons.template.setAll({
  tooltipText: "{name}: {value}"
});

polygonSeries.set("heatRules", [{
  target: polygonSeries.mapPolygons.template,
  dataField: "value",
  min: am5.color(0xff621f),
  max: am5.color(0x661f00),
  key: "fill"
}]);

polygonSeries.mapPolygons.template.events.on("pointerover", function(ev) {
  heatLegend.showValue(ev.target.dataItem.get("value"));
});

polygonSeries.data.setAll([
  { id: "US-AL", value: 4447100 },
  { id: "US-AK", value: 626932 },
  { id: "US-AZ", value: 5130632 },
  { id: "US-AR", value: 2673400 },
  { id: "US-CA", value: 33871648 },
  { id: "US-CO", value: 4301261 },
  { id: "US-CT", value: 3405565 },
  { id: "US-DE", value: 783600 },
  { id: "US-FL", value: 15982378 },
  { id: "US-GA", value: 8186453 },
  { id: "US-HI", value: 1211537 },
  { id: "US-ID", value: 1293953 },
  { id: "US-IL", value: 12419293 },
  { id: "US-IN", value: 6080485 },
  { id: "US-IA", value: 2926324 },
  { id: "US-KS", value: 2688418 },
  { id: "US-KY", value: 4041769 },
  { id: "US-LA", value: 4468976 },
  { id: "US-ME", value: 1274923 },
  { id: "US-MD", value: 5296486 },
  { id: "US-MA", value: 6349097 },
  { id: "US-MI", value: 9938444 },
  { id: "US-MN", value: 4919479 },
  { id: "US-MS", value: 2844658 },
  { id: "US-MO", value: 5595211 },
  { id: "US-MT", value: 902195 },
  { id: "US-NE", value: 1711263 },
  { id: "US-NV", value: 1998257 },
  { id: "US-NH", value: 1235786 },
  { id: "US-NJ", value: 8414350 },
  { id: "US-NM", value: 1819046 },
  { id: "US-NY", value: 18976457 },
  { id: "US-NC", value: 8049313 },
  { id: "US-ND", value: 642200 },
  { id: "US-OH", value: 11353140 },
  { id: "US-OK", value: 3450654 },
  { id: "US-OR", value: 3421399 },
  { id: "US-PA", value: 12281054 },
  { id: "US-RI", value: 1048319 },
  { id: "US-SC", value: 4012012 },
  { id: "US-SD", value: 754844 },
  { id: "US-TN", value: 5689283 },
  { id: "US-TX", value: 20851820 },
  { id: "US-UT", value: 2233169 },
  { id: "US-VT", value: 608827 },
  { id: "US-VA", value: 7078515 },
  { id: "US-WA", value: 5894121 },
  { id: "US-WV", value: 1808344 },
  { id: "US-WI", value: 5363675 },
  { id: "US-WY", value: 493782 }
]);

var heatLegend = chart.children.push(am5.HeatLegend.new(root, {
  orientation: "vertical",
  startColor: am5.color(0xff621f),
  endColor: am5.color(0x661f00),
  startText: "Lowest",
  endText: "Highest",
  stepCount: 5
}));

heatLegend.startLabel.setAll({
  fontSize: 12,
  fill: heatLegend.get("startColor")
});

heatLegend.endLabel.setAll({
  fontSize: 12,
  fill: heatLegend.get("endColor")
});

// change this to template when possible
polygonSeries.events.on("datavalidated", function () {
  heatLegend.set("startValue", polygonSeries.getPrivate("valueLow"));
  heatLegend.set("endValue", polygonSeries.getPrivate("valueHigh"));
});

}); // end am5.ready()
</script>

<!-- HTML -->
<div id="chartdiv"></div>