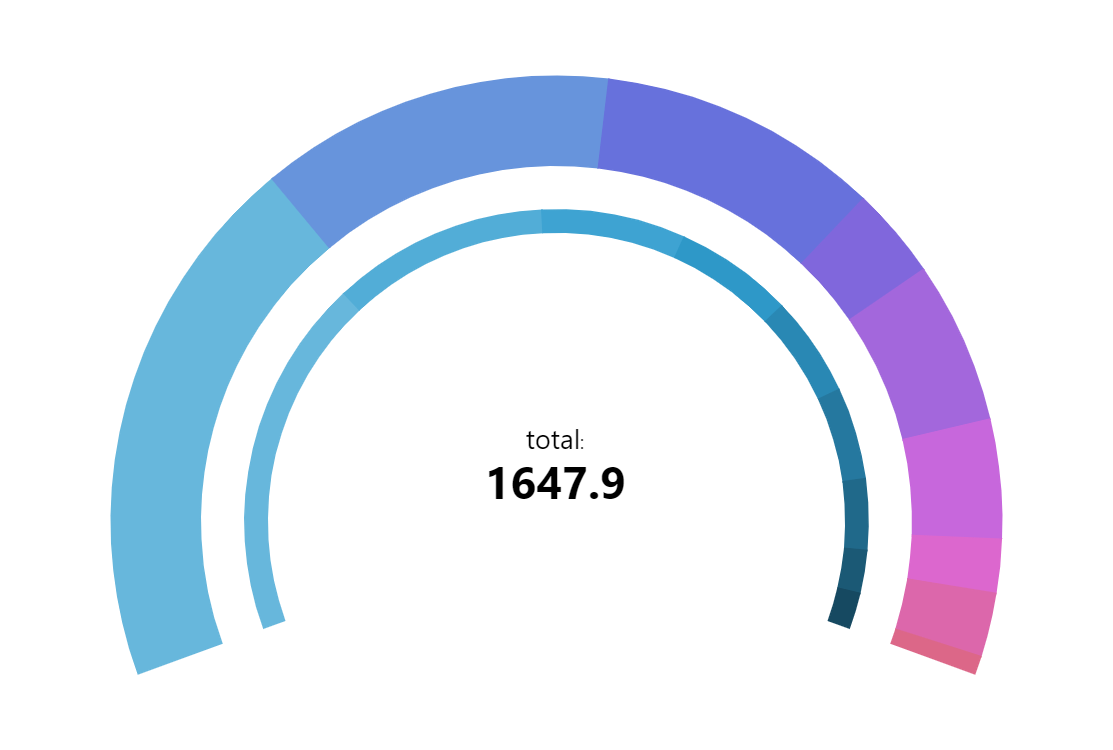
Variable-Radius Nested Donut Chart
amCharts supports nested pie/donut series. By default it would automatically spread the series within the whole pie. But you can also control [outer] radius and innerRadius of each series to achieve the look you want. Moreover, pie/donut charts don’t have to be fully circular.
Key implementation details
We set startAngle and endAngle on the chart and each series to achieve the overall arc shape. Then we set innerRadius and radius on the series to control the space each of them occupies.
Related tutorials
Demo source
<!-- Styles -->
<style>
#chartdiv {
  width: 100%;
  height: 500px;
}
</style>

<!-- Resources -->
<script src="https://cdn.amcharts.com/lib/5/index.js"></script>
<script src="https://cdn.amcharts.com/lib/5/percent.js"></script>
<script src="https://cdn.amcharts.com/lib/5/themes/Animated.js"></script>

<!-- Chart code -->
<script>
am5.ready(function() {

// Create root element
// https://www.amcharts.com/docs/v5/getting-started/#Root_element
var root = am5.Root.new("chartdiv");

// Set themes
// https://www.amcharts.com/docs/v5/concepts/themes/
root.setThemes([
  am5themes_Animated.new(root)
]);

// Create chart
// https://www.amcharts.com/docs/v5/charts/percent-charts/pie-chart/
var chart = root.container.children.push(
  am5percent.PieChart.new(root, {
    startAngle: 160, endAngle: 380
  })
);

// Create series
// https://www.amcharts.com/docs/v5/charts/percent-charts/pie-chart/#Series

var series0 = chart.series.push(
  am5percent.PieSeries.new(root, {
    valueField: "litres",
    categoryField: "country",
    startAngle: 160,
    endAngle: 380,
    radius: am5.percent(70),
    innerRadius: am5.percent(65)
  })
);

var colorSet = am5.ColorSet.new(root, {
  colors: [series0.get("colors").getIndex(0)],
  passOptions: {
    lightness: -0.05,
    hue: 0
  }
});

series0.set("colors", colorSet);

series0.ticks.template.set("forceHidden", true);
series0.labels.template.set("forceHidden", true);

var series1 = chart.series.push(
  am5percent.PieSeries.new(root, {
    startAngle: 160,
    endAngle: 380,
    valueField: "bottles",
    innerRadius: am5.percent(80),
    categoryField: "country"
  })
);

series1.ticks.template.set("forceHidden", true);
series1.labels.template.set("forceHidden", true);

var label = chart.seriesContainer.children.push(
  am5.Label.new(root, {
    textAlign: "center",
    centerY: am5.p100,
    centerX: am5.p50,
    text: "[fontSize:18px]total[/]:\n[bold fontSize:30px]1647.9[/]"
  })
);

var data = [
  {
    country: "Lithuania",
    litres: 501.9,
    bottles: 1500
  },
  {
    country: "Czech Republic",
    litres: 301.9,
    bottles: 990
  },
  {
    country: "Ireland",
    litres: 201.1,
    bottles: 785
  },
  {
    country: "Germany",
    litres: 165.8,
    bottles: 255
  },
  {
    country: "Australia",
    litres: 139.9,
    bottles: 452
  },
  {
    country: "Austria",
    litres: 128.3,
    bottles: 332
  },
  {
    country: "UK",
    litres: 99,
    bottles: 150
  },
  {
    country: "Belgium",
    litres: 60,
    bottles: 178
  },
  {
    country: "The Netherlands",
    litres: 50,
    bottles: 50
  }
];

// Set data
// https://www.amcharts.com/docs/v5/charts/percent-charts/pie-chart/#Setting_data
series0.data.setAll(data);
series1.data.setAll(data);

}); // end am5.ready()
</script>

<!-- HTML -->
<div id="chartdiv"></div>