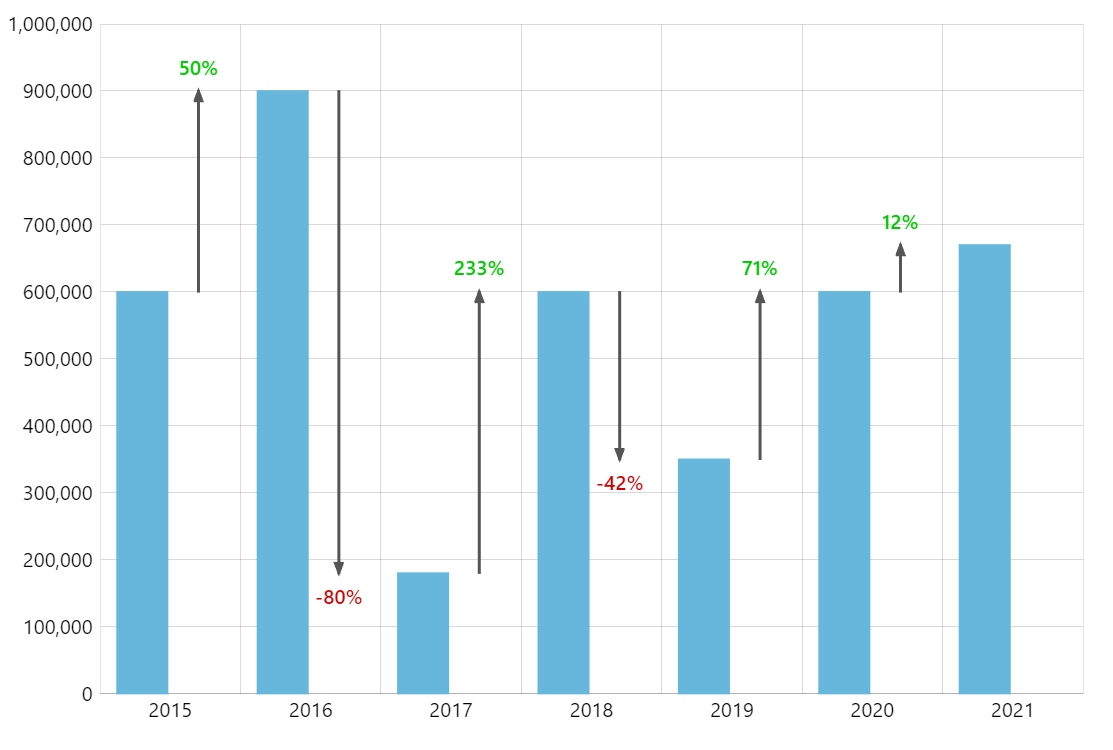
Variance Indicators
A clever use of highly configurable clustered Column series and adapters enables us to create automatically-calculated variance indicators.
Key implementation details
While from the viewer’s perspective we see one column series and arrows next to it, from the developer’s perspective these are two column series. One is your regular column series, and the other cleverly uses openValueYField with the current value to make “columns” start off-axis, and valueYField with calculated (next column’s value) values.
Then we create custom graphics arrow bullets and rotate them in the bullet’s adapter based on the calculated variance.
Related tutorials
Demo source
<!-- Styles -->
<style>
#chartdiv {
  width: 100%;
  height: 350px;
}
</style>

<!-- Resources -->
<script src="https://cdn.amcharts.com/lib/5/index.js"></script>
<script src="https://cdn.amcharts.com/lib/5/xy.js"></script>
<script src="https://cdn.amcharts.com/lib/5/themes/Animated.js"></script>

<!-- Chart code -->
<script>
am5.ready(function() {

// Create root element
// https://www.amcharts.com/docs/v5/getting-started/#Root_element
var root = am5.Root.new("chartdiv");


// Set themes
// https://www.amcharts.com/docs/v5/concepts/themes/
root.setThemes([
  am5themes_Animated.new(root)
]);


// Create chart
// https://www.amcharts.com/docs/v5/charts/xy-chart/
var chart = root.container.children.push(am5xy.XYChart.new(root, {
  panX: false,
  panY: false,
  wheelX: "none",
  wheelY: "none",
  layout: root.verticalLayout,
  paddingLeft: 0
}));


// Data
var data = [{
  year: "2015",
  value: 600000
}, {
  year: "2016",
  value: 900000
}, {
  year: "2017",
  value: 180000
}, {
  year: "2018",
  value: 600000
}, {
  year: "2019",
  value: 350000
}, {
  year: "2020",
  value: 600000
}, {
  year: "2021",
  value: 670000
}];

// Populate data
for (var i = 0; i < (data.length - 1); i++) {
  data[i].valueNext = data[i + 1].value;
}


// Create axes
// https://www.amcharts.com/docs/v5/charts/xy-chart/axes/
var xRenderer = am5xy.AxisRendererX.new(root, {
  cellStartLocation: 0.1,
  cellEndLocation: 0.9,
  minGridDistance: 30,
  minorGridEnabled: true
});

var xAxis = chart.xAxes.push(am5xy.CategoryAxis.new(root, {
  categoryField: "year",
  renderer: xRenderer,
  tooltip: am5.Tooltip.new(root, {})
}));

xRenderer.grid.template.setAll({
  location: 1
})

xAxis.data.setAll(data);

var yAxis = chart.yAxes.push(am5xy.ValueAxis.new(root, {
  min: 0,
  renderer: am5xy.AxisRendererY.new(root, {
    strokeOpacity: 0.1
  })
}));


// Add series
// https://www.amcharts.com/docs/v5/charts/xy-chart/series/

// Column series
var series = chart.series.push(am5xy.ColumnSeries.new(root, {
  xAxis: xAxis,
  yAxis: yAxis,
  valueYField: "value",
  categoryXField: "year"
}));

series.columns.template.setAll({
  tooltipText: "{categoryX}: {valueY}",
  width: am5.percent(90),
  tooltipY: 0
});

series.data.setAll(data);

// Variance indicator series
var series2 = chart.series.push(am5xy.ColumnSeries.new(root, {
  xAxis: xAxis,
  yAxis: yAxis,
  valueYField: "valueNext",
  openValueYField: "value",
  categoryXField: "year",
  fill: am5.color(0x555555),
  stroke: am5.color(0x555555)
}));

series2.columns.template.setAll({
  width: 1
});

series2.data.setAll(data);

series2.bullets.push(function () {
  var label = am5.Label.new(root, {
    text: "{valueY}",
    fontWeight: "500",
    fill: am5.color(0x00cc00),
    centerY: am5.p100,
    centerX: am5.p50,
    populateText: true
  });

  // Modify text of the bullet with percent
  label.adapters.add("text", function (text, target) {
    var percent = getVariancePercent(target.dataItem);
    return percent ? percent + "%" : text;
  });

  // Set dynamic color of the bullet
  label.adapters.add("centerY", function (center, target) {
    return getVariancePercent(target.dataItem) < 0 ? 0 : center;
  });

  // Set dynamic color of the bullet
  label.adapters.add("fill", function (fill, target) {
    return getVariancePercent(target.dataItem) < 0 ? am5.color(0xcc0000) : fill;
  });

  return am5.Bullet.new(root, {
    locationY: 1,
    sprite: label
  });
});

series2.bullets.push(function () {
  var arrow = am5.Graphics.new(root, {
    rotation: -90,
    centerX: am5.p50,
    centerY: am5.p50,
    dy: 3,
    fill: am5.color(0x555555),
    stroke: am5.color(0x555555),
    draw: function (display) {
      display.moveTo(0, -3);
      display.lineTo(8, 0);
      display.lineTo(0, 3);
      display.lineTo(0, -3);
    }
  });

  arrow.adapters.add("rotation", function (rotation, target) {
    return getVariancePercent(target.dataItem) < 0 ? 90 : rotation;
  });

  arrow.adapters.add("dy", function (dy, target) {
    return getVariancePercent(target.dataItem) < 0 ? -3 : dy;
  });

  return am5.Bullet.new(root, {
    locationY: 1,
    sprite: arrow
  })
})


// Make stuff animate on load
// https://www.amcharts.com/docs/v5/concepts/animations/
series.appear();
chart.appear(1000, 100);


function getVariancePercent(dataItem) {
  if (dataItem) {
    var value = dataItem.get("valueY");
    var openValue = dataItem.get("openValueY");
    var change = value - openValue;
    return Math.round(change / openValue * 100);
  }
  return 0;
}

}); // end am5.ready()
</script>

<!-- HTML -->
<div id="chartdiv"></div>