Venn Diagram
A Venn diagram (also know as primary diagram, set diagram or logic diagram) shows all possible logical relations between different sets. Learn more about Venn diagrams in the documentation.
Related tutorials
Demo source
<!-- Styles -->
<style>
#chartdiv {
width: 100%;
height: 500px;
}
</style>
<!-- Resources -->
<script src="https://cdn.amcharts.com/lib/5/index.js"></script>
<script src="https://cdn.amcharts.com/lib/5/venn.js"></script>
<script src="https://cdn.amcharts.com/lib/5/themes/Animated.js"></script>
<!-- Chart code -->
<script>
am5.ready(function() {
// Create root
var root = am5.Root.new("chartdiv");
// Set themes
root.setThemes([
am5themes_Animated.new(root)
]);
// Create wrapper container
var container = root.container.children.push(am5.Container.new(root, {
width: am5.p100,
height: am5.p100,
layout: root.verticalLayout
}));
// Create venn series
var chart = container.children.push(am5venn.Venn.new(root, {
categoryField: "name",
valueField: "value",
intersectionsField: "sets",
paddingTop: 40,
paddingBottom: 40,
paddingLeft: 40,
paddingRight: 40
}));
// Set data
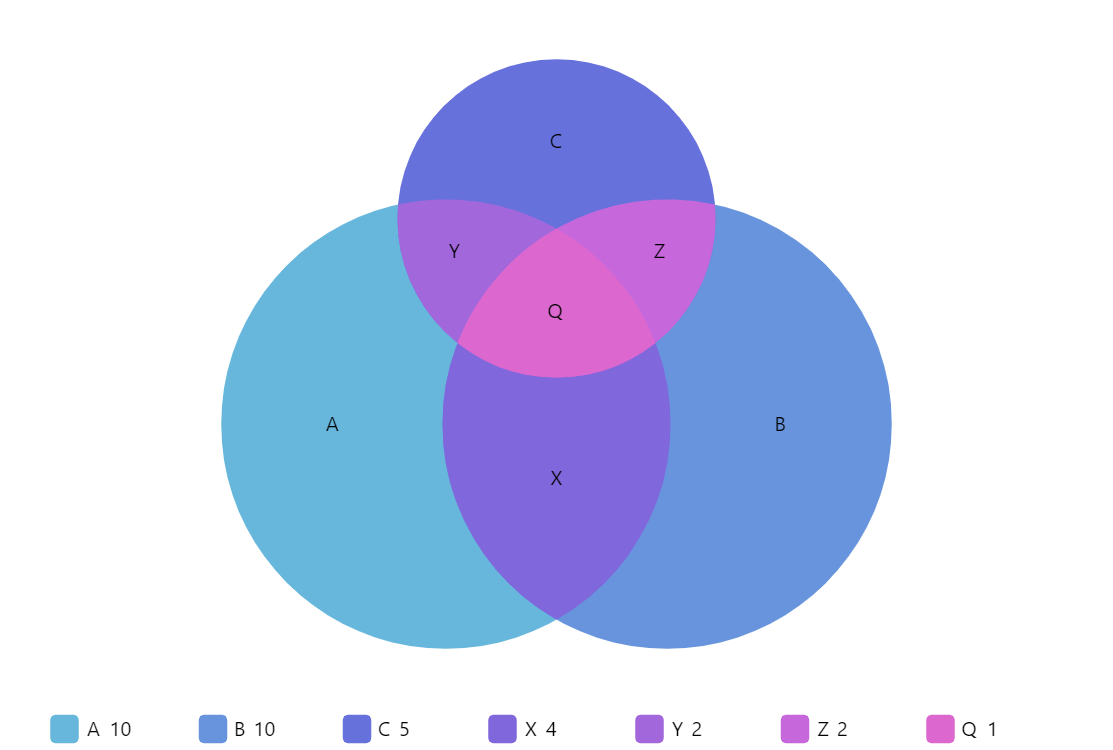
chart.data.setAll([
{ name: "A", value: 10 },
{ name: "B", value: 10 },
{ name: "C", value: 5 },
{ name: "X", value: 4, sets: ["A", "B"] },
{ name: "Y", value: 2, sets: ["A", "C"] },
{ name: "Z", value: 2, sets: ["B", "C"] },
{ name: "Q", value: 1, sets: ["A", "B", "C"]
}]);
// Set tooltip content
chart.slices.template.set("tooltipText", "{category}: {value}");
// Set up hover appearance
chart.hoverGraphics.setAll({
strokeDasharray: [3, 3],
stroke: am5.color(0xffffff),
strokeWidth: 2
});
// Add legend
var legend = container.children.push(
am5.Legend.new(root, {
centerX: am5.p50,
x: am5.p50
})
);
legend.data.setAll(chart.dataItems);
}); // end am5.ready()
</script>
<!-- HTML -->
<div id="chartdiv"></div>