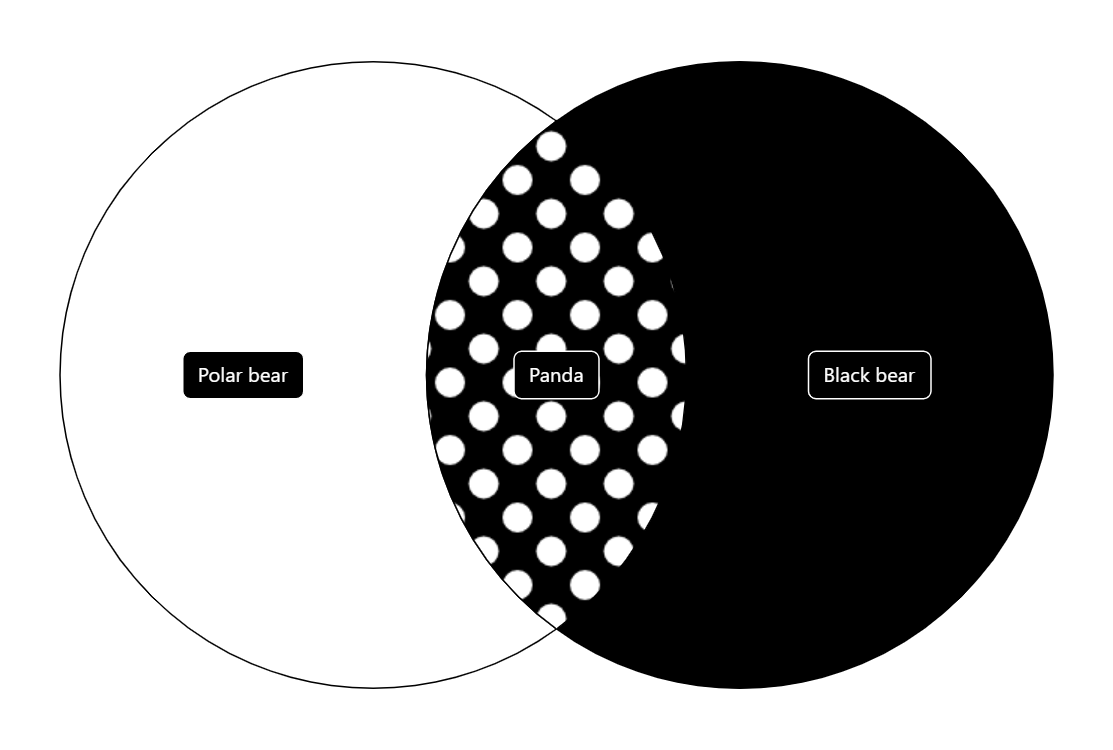
Venn Diagram with Patterns
Venn diagrams are one of the most popular diagram types for showing relationships between sets of data.
Related tutorials
Demo source
<!-- Styles -->
<style>
#chartdiv {
  width: 100%;
  height: 500px;
}
</style>

<!-- Resources -->
<script src="https://cdn.amcharts.com/lib/5/index.js"></script>
<script src="https://cdn.amcharts.com/lib/5/venn.js"></script>
<script src="https://cdn.amcharts.com/lib/5/themes/Animated.js"></script>

<!-- Chart code -->
<script>
am5.ready(function() {

// Create root
var root = am5.Root.new("chartdiv");

// Set themes
root.setThemes([
  am5themes_Animated.new(root)
]);

// Create wrapper container
var container = root.container.children.push(am5.Container.new(root, {
  width: am5.p100,
  height: am5.p100,
  layout: root.verticalLayout
}));

// Create venn series
var chart = container.children.push(am5venn.Venn.new(root, {
  categoryField: "name",
  valueField: "value",
  intersectionsField: "sets",
  paddingTop: 40,
  paddingBottom: 40,
  paddingLeft: 40,
  paddingRight: 40
}));

var pattern = am5.CirclePattern.new(root, {
  fill: am5.color(0x000000),
  color: am5.color(0xffffff),
  radius: 10,
  gap: 10,
  checkered: true
})

chart.slices.template.setAll({ templateField: "sliceSettings" });
chart.labels.template.set("fill", am5.color(0xffffff));
chart.labels.template.setup = function(target) {
  target.set("background", am5.RoundedRectangle.new(root, {
    stroke: am5.color(0xffffff),
    fill: am5.color(0x000000),
    cornerRadiusTL: 5,
    cornerRadiusTR: 5,
    cornerRadiusBL: 5,
    cornerRadiusBR: 5,
    fillOpacity: 1
  }));
}

// Set data
chart.data.setAll([{
	name: "Polar bear",
	value: 100,
	sliceSettings: {
		fill: am5.color(0xFFFFFF),
		stroke: am5.color(0x000000)
	}
}, {
	name: "Black bear",
	value: 100,
	sliceSettings: {
		fill: am5.color(0x000000),
		stroke: am5.color(0x000000)
	}
}, {
	name: "Panda",
	value: 30,
	sets: ["Polar bear", "Black bear"],
	sliceSettings: {
		fillPattern: pattern,
		stroke: am5.color(0x000000)
	}
}]);


// Set up hover appearance
chart.hoverGraphics.setAll({
  strokeDasharray: [3, 3],
  stroke: am5.color(0xffffff),
  strokeWidth: 2
});

}); // end am5.ready()
</script>

<!-- HTML -->
<div id="chartdiv"></div>