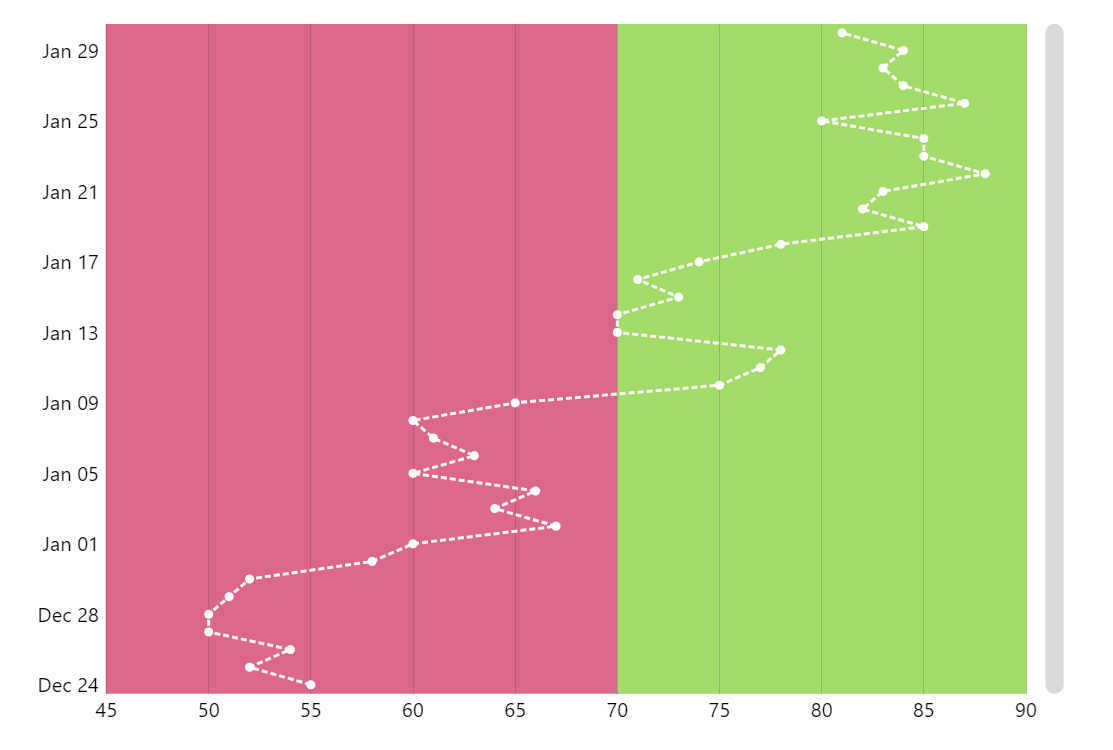
Vertical Line Chart
Need your line chart to go from the bottom to the top instead of left to right? No problem with amCharts.
Key implementation details
We just add a DateAxis as our Y axis and ValueAxis as our X axis and set the value fields on the LineSeries accordingly.
Related tutorials
Demo source
<!-- Styles -->
<style>
#chartdiv {
  width: 100%;
  height: 500px;
}
</style>

<!-- Resources -->
<script src="https://cdn.amcharts.com/lib/5/index.js"></script>
<script src="https://cdn.amcharts.com/lib/5/xy.js"></script>
<script src="https://cdn.amcharts.com/lib/5/themes/Animated.js"></script>

<!-- Chart code -->
<script>
am5.ready(function() {

// Create root element
// https://www.amcharts.com/docs/v5/getting-started/#Root_element
var root = am5.Root.new("chartdiv");

// Set themes
// https://www.amcharts.com/docs/v5/concepts/themes/
root.setThemes([
  am5themes_Animated.new(root)
]);

root.dateFormatter.setAll({
  dateFormat: "yyyy",
  dateFields: ["valueY"]
});

var data = [
  {
    date: "2012-12-24",
    value: 55
  },
  {
    date: "2012-12-25",
    value: 52
  },
  {
    date: "2012-12-26",
    value: 54
  },
  {
    date: "2012-12-27",
    value: 50
  },
  {
    date: "2012-12-28",
    value: 50
  },
  {
    date: "2012-12-29",
    value: 51
  },
  {
    date: "2012-12-30",
    value: 52
  },
  {
    date: "2012-12-31",
    value: 58
  },
  {
    date: "2013-01-01",
    value: 60
  },
  {
    date: "2013-01-02",
    value: 67
  },
  {
    date: "2013-01-03",
    value: 64
  },
  {
    date: "2013-01-04",
    value: 66
  },
  {
    date: "2013-01-05",
    value: 60
  },
  {
    date: "2013-01-06",
    value: 63
  },
  {
    date: "2013-01-07",
    value: 61
  },
  {
    date: "2013-01-08",
    value: 60
  },
  {
    date: "2013-01-09",
    value: 65
  },
  {
    date: "2013-01-10",
    value: 75
  },
  {
    date: "2013-01-11",
    value: 77
  },
  {
    date: "2013-01-12",
    value: 78
  },
  {
    date: "2013-01-13",
    value: 70
  },
  {
    date: "2013-01-14",
    value: 70
  },
  {
    date: "2013-01-15",
    value: 73
  },
  {
    date: "2013-01-16",
    value: 71
  },
  {
    date: "2013-01-17",
    value: 74
  },
  {
    date: "2013-01-18",
    value: 78
  },
  {
    date: "2013-01-19",
    value: 85
  },
  {
    date: "2013-01-20",
    value: 82
  },
  {
    date: "2013-01-21",
    value: 83
  },
  {
    date: "2013-01-22",
    value: 88
  },
  {
    date: "2013-01-23",
    value: 85
  },
  {
    date: "2013-01-24",
    value: 85
  },
  {
    date: "2013-01-25",
    value: 80
  },
  {
    date: "2013-01-26",
    value: 87
  },
  {
    date: "2013-01-27",
    value: 84
  },
  {
    date: "2013-01-28",
    value: 83
  },
  {
    date: "2013-01-29",
    value: 84
  },
  {
    date: "2013-01-30",
    value: 81
  }
];

// Create chart
// https://www.amcharts.com/docs/v5/charts/xy-chart/
var chart = root.container.children.push(
  am5xy.XYChart.new(root, {
    focusable: true,
    panX: true,
    panY: true,
    wheelX: "panY",
    wheelY: "zoomY",
paddingLeft:45
  })
);

var easing = am5.ease.linear;

// Create axes
// https://www.amcharts.com/docs/v5/charts/xy-chart/axes/
var yAxis = chart.yAxes.push(
  am5xy.DateAxis.new(root, {
    maxDeviation: 0.1,
    groupData: false,
    baseInterval: {
      timeUnit: "day",
      count: 1
    },
    renderer: am5xy.AxisRendererY.new(root, {
      minorGridEnabled: true
    }),
    tooltip: am5.Tooltip.new(root, {})
  })
);

var xAxis = chart.xAxes.push(
  am5xy.ValueAxis.new(root, {
    maxDeviation: 0,
    renderer: am5xy.AxisRendererX.new(root, { minGridDistance: 50 })
  })
);

// Add series
// https://www.amcharts.com/docs/v5/charts/xy-chart/series/
var series = chart.series.push(
  am5xy.LineSeries.new(root, {
    minBulletDistance: 10,
    connect: false,
    xAxis: xAxis,
    yAxis: yAxis,
    valueXField: "value",
    valueYField: "date",
    stroke: am5.color(0xffffff),
    fill: am5.color(0xffffff),
    tooltip: am5.Tooltip.new(root, {
      pointerOrientation: "vertical",
      dy: -3,
      labelText: "{valueX}"
    })
  })
);

// Set up data processor to parse string dates
// https://www.amcharts.com/docs/v5/concepts/data/#Pre_processing_data
series.data.processor = am5.DataProcessor.new(root, {
  dateFormat: "yyyy-MM-dd",
  dateFields: ["date"]
});

series.strokes.template.setAll({ strokeDasharray: [4, 2], strokeWidth: 2 });
series.data.setAll(data);

series.bullets.push(function () {
  var circle = am5.Circle.new(root, {
    radius: 3,
    fill: root.interfaceColors.get("background")
  });

  return am5.Bullet.new(root, {
    sprite: circle
  });
});

// add axis ranges
var colorSet = chart.get("colors");

var range0DataItem = xAxis.makeDataItem({
  value: 40,
  endValue: 70
});
xAxis.createAxisRange(range0DataItem);

range0DataItem.get("axisFill").setAll({
  visible: true,
  fillOpacity: 1,
  fill: colorSet.getIndex(8)
});

var range1DataItem = xAxis.makeDataItem({
  value: 70,
  endValue: 100
});
xAxis.createAxisRange(range1DataItem);

range1DataItem.get("axisFill").setAll({
  visible: true,
  fillOpacity: 1,
  fill: colorSet.getIndex(14)
});

// put axis ranges to back
chart.plotContainer.children.moveValue(chart.topGridContainer, 0);

// Add cursor
// https://www.amcharts.com/docs/v5/charts/xy-chart/cursor/
var cursor = chart.set(
  "cursor",
  am5xy.XYCursor.new(root, {
    yAxis: yAxis,
    behavior: "none"
  })
);
cursor.lineX.set("visible", false);

// add scrollbar
chart.set("scrollbarY", am5.Scrollbar.new(root, { orientation: "vertical" }));

// Make stuff animate on load
// https://www.amcharts.com/docs/v5/concepts/animations/
chart.appear(1000, 100);

}); // end am5.ready()
</script>

<!-- HTML -->
<div id="chartdiv"></div>